
Compare Cupid with Similar Stocks
Dashboard
The company is Net-Debt Free
Healthy long term growth as Operating profit has grown by an annual rate 30.35%
With a growth in Net Sales of 28.3%, the company declared Outstanding results in Mar 26
Consistent Returns over the last 3 years
With its market cap of Rs 24,554 cr, it is the biggest company in the sector and constitutes 69.90% of the entire sector
Total Returns (Price + Dividend) 
Latest dividend: 0.03 per share ex-dividend date: Sep-18-2023
Risk Adjusted Returns v/s
Returns Beta

News
Cupid Ltd is Rated Buy by MarketsMOJO
Cupid Ltd is rated Buy by MarketsMOJO, with this rating last updated on 27 March 2026. However, the analysis and financial metrics discussed here reflect the stock’s current position as of 26 June 2026, providing investors with the latest insights into the company’s performance and outlook.
Read full news article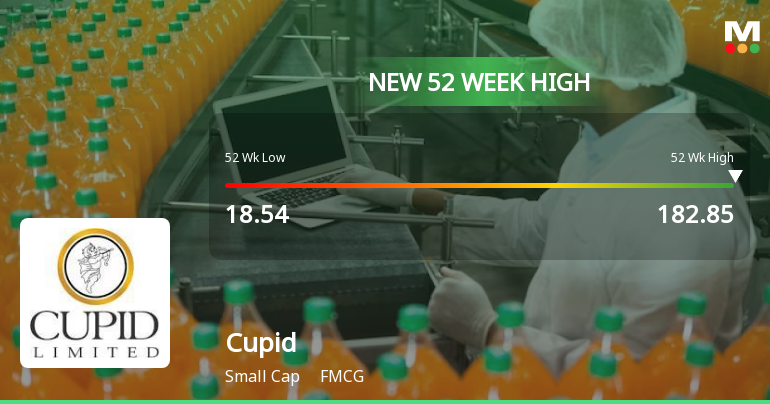
Cupid Ltd Hits New 52-Week High of Rs 183 on Back of Strong Technical Signals
From a low of Rs 18.54 to a striking Rs 183 in just one year, Cupid Ltd has delivered an extraordinary 783.33% return, surging well ahead of the Sensex’s 6.37% decline over the same period. This remarkable rally culminated in the stock hitting a fresh 52-week high today, buoyed by a confluence of robust technical indicators and sustained price momentum.
Read full news article
Announcements
Intimation Of Disclosure Under Regulation 29(2) Of SEBI (SAST) Regulations 2011
03-Jun-2026 | Source : BSECupid Limited is hereby informing BSE about Disclosure under Regulation 29 (2) of SEBI (SAST) Regulations 2011
Disclosures under Reg. 29(2) of SEBI (SAST) Regulations 2011
03-Jun-2026 | Source : BSEThe Exchange has received the disclosure under Regulation 29(2) of SEBI (Substantial Acquisition of Shares & Takeovers) Regulations 2011 for Aditya Kumar Halwasiya
Disclosures under Reg. 29(2) of SEBI (SAST) Regulations 2011
03-Jun-2026 | Source : BSEThe Exchange has received the disclosure under Regulation 29(2) of SEBI (Substantial Acquisition of Shares & Takeovers) Regulations 2011 for Aditya Kumar Halwasiya
Corporate Actions

No Upcoming Board Meetings

Cupid Ltd has declared 30% dividend, ex-date: 18 Sep 23

Cupid Ltd has announced 1:10 stock split, ex-date: 04 Apr 24

Cupid Ltd has announced 4:1 bonus issue, ex-date: 09 Mar 26

No Rights history available
Quality key factors
Valuation key factors
Technicals key factors
 Technical Indicator Scale: Bearish, Mildly Bearish, Sideways, Mildly Bullish, Bullish Turned
 Shareholding Snapshot : Mar 2026
Shareholding Compare (%holding)
Non Institution
24.7852
Held by 1 Schemes (0.0%)
Held by 18 FIIs (0.91%)
Aditya Kumar Halwasiya (32.9%)
Setu Securities Pvt Ltd (3.6%)
24.74%
Quarterly Results Snapshot (Consolidated) - Mar'26 - QoQ

QoQ Growth in quarter ended Mar 2026 is 28.30% vs 10.72% in Dec 2025

QoQ Growth in quarter ended Mar 2026 is 10.45% vs 36.05% in Dec 2025
Half Yearly Results Snapshot (Consolidated) - Sep'25
Not Applicable: The company has declared_date for only one period
Not Applicable: The company has declared_date for only one period
Nine Monthly Results Snapshot (Consolidated) - Dec'25
YoY Growth in nine months ended Dec 2025 is 87.15% vs 21.43% in Dec 2024
YoY Growth in nine months ended Dec 2025 is 145.05% vs 131.08% in Dec 2024
Annual Results Snapshot (Consolidated) - Mar'26
YoY Growth in year ended Mar 2026 is 94.92% vs 7.27% in Mar 2025
YoY Growth in year ended Mar 2026 is 164.69% vs 2.61% in Mar 2025
About Cupid Ltd

Company Coordinates


