

Key Events This Week
1 June: New 52-week high at Rs.53.29
1 June: Exceptional volume surge with 2.65 crore shares traded
5 June: Week closes at Rs.57.81, up 12.12%
Paisalo Digital Gains 2.39%: 4 Key Factors Driving the Week’s Momentum
Key Events This Week
8 June: New 52-week high of Rs.60.51 amid exceptional volume surge
9 June: Further 52-week high at Rs.60.90, continuing upward momentum
10 June: New 52-week high at Rs.61.02, marking six consecutive days of gains
11-12 June: Price consolidation with minor declines and recovery, closing at Rs.59.19
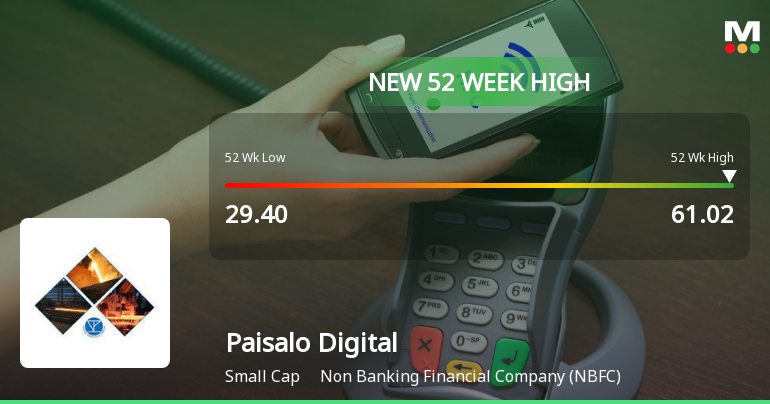
Paisalo Digital Ltd Hits New 52-Week High of Rs 61.02 on Back of Strong Technical Signals
Surging past its previous peak, Paisalo Digital Ltd touched a fresh 52-week high of Rs 61.02 on 10 Jun 2026, marking a remarkable rally of 85.35% over the past year. This milestone comes amid a sustained six-day winning streak, reflecting robust price momentum and a confluence of bullish technical indicators.
Read full news article Announcements 
Disclosures under Reg. 31(1) and 31(2) of SEBI (SAST) Regulations 2011.
10-Jun-2026 | Source : BSEThe Exchange has received Disclosure under Regulation 31(1) and 31(2) of SEBI (Substantial Acquisition of Shares & Takeovers) Regulations 2011 on June 10 2026 for Equilibrated Venture Cflow Pvt Ltd
Disclosures under Reg. 31(1) and 31(2) of SEBI (SAST) Regulations 2011.
10-Jun-2026 | Source : BSEThe Exchange has received Disclosure under Regulation 31(1) and 31(2) of SEBI (Substantial Acquisition of Shares & Takeovers) Regulations 2011 on June 10 2026 for Equilibrated Venture Cflow Pvt Ltd Pri Caf Pvt Ltd & Pro Fitcch Pvt Ltd
Disclosures of reasons for encumbrance by promoter of listed companies under Reg. 31(1) read with Regulation 28(3) of SEBI (SAST) Regulations 2011.
10-Jun-2026 | Source : BSEThe Exchange has received the Disclosures of reasons for encumbrance by promoter of listed companies under Reg. 31(1) read with Regulation 28(3) of SEBI (SAST) Regulations 2011 on June 10 2026 for Equilibrated Venture Cflow Pvt Ltd Pri Caf Pvt Ltd & Pro Fitcch Pvt Ltd
Corporate Actions

No Upcoming Board Meetings

Paisalo Digital Ltd has declared 10% dividend, ex-date: 22 Sep 25

Paisalo Digital Ltd has announced 1:10 stock split, ex-date: 30 Jun 22

Paisalo Digital Ltd has announced 1:1 bonus issue, ex-date: 20 Mar 24

No Rights history available
Quality key factors
Valuation key factors
Technicals key factors
 Technical Indicator Scale: Bearish, Mildly Bearish, Sideways, Mildly Bullish, Bullish Turned
 Shareholding Snapshot : Mar 2026
Shareholding Compare (%holding)
Promoters
21.735
Held by 1 Schemes (0.0%)
Held by 53 FIIs (17.54%)
Equilibrated Venture Cflow Private Limited (20.53%)
Sbi Life Insurance Co. Ltd (6.83%)
15.27%
Quarterly Results Snapshot (Consolidated) - Mar'26 - QoQ

QoQ Growth in quarter ended Mar 2026 is 8.69% vs 7.16% in Dec 2025

QoQ Growth in quarter ended Mar 2026 is 9.01% vs 28.56% in Dec 2025
Half Yearly Results Snapshot (Consolidated) - Sep'25
Growth in half year ended Sep 2025 is 18.51% vs 33.01% in Sep 2024
Growth in half year ended Sep 2025 is 8.00% vs 6.40% in Sep 2024
Nine Monthly Results Snapshot (Consolidated) - Dec'25
YoY Growth in nine months ended Dec 2025 is 18.26% vs 24.57% in Dec 2024
YoY Growth in nine months ended Dec 2025 is 7.24% vs 8.06% in Dec 2024
Annual Results Snapshot (Consolidated) - Mar'26
YoY Growth in year ended Mar 2026 is 22.38% vs 17.06% in Mar 2025
YoY Growth in year ended Mar 2026 is 18.53% vs 11.82% in Mar 2025
About Paisalo Digital Ltd

Company Coordinates


