
Compare Panorama Studios with Similar Stocks
Dashboard
With a fall in Operating Profit of -9.63%, the company declared Very Negative results in Mar 26
- The company has declared negative results for the last 4 consecutive quarters
- NET SALES(Latest six months) At Rs 94.30 cr has Grown at -61.73%
- PAT(Latest six months) At Rs 8.51 cr has Grown at -73.62%
- ROCE(HY) Lowest at 7.78%
With ROCE of 6.1, it has a Very Expensive valuation with a 4.2 Enterprise value to Capital Employed
26.55% of Promoter Shares are Pledged
Stock DNA
Media & Entertainment
INR 1,224 Cr (Micro Cap)
80.00
61
0.12%
0.46
7.09%
5.58
Total Returns (Price + Dividend) 
Latest dividend: 0.2 per share ex-dividend date: Sep-23-2025
Risk Adjusted Returns v/s
Returns Beta

News

Panorama Studios International Ltd Sees Mixed Technical Signals Amid Sideways Momentum
Panorama Studios International Ltd, a micro-cap player in the Media & Entertainment sector, has experienced a notable shift in price momentum and technical indicators, reflecting a complex market stance. Despite a recent downgrade in its Mojo Grade from Strong Sell to Sell, the stock’s technical parameters reveal a blend of bullish and bearish signals, suggesting sideways movement in the near term.
Read full news article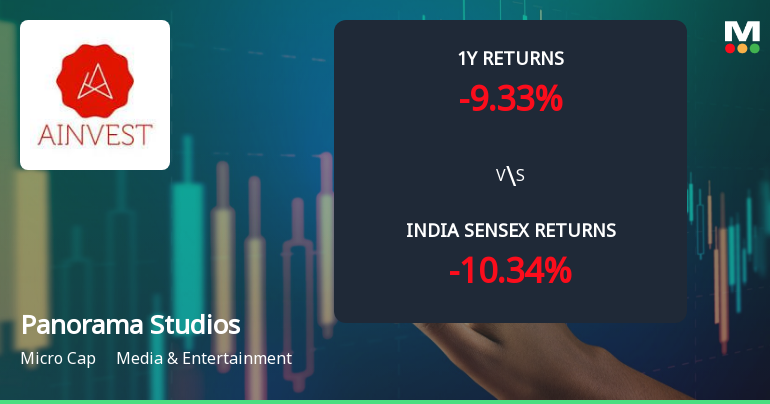
Panorama Studios International Ltd Shows Signs of Mild Bullish Momentum Amid Mixed Technical Signals
Panorama Studios International Ltd, a micro-cap player in the Media & Entertainment sector, has exhibited a subtle shift in its technical momentum, moving from a sideways trend to a mildly bullish stance. Despite a marginal day decline of 0.10%, the stock’s technical indicators present a nuanced picture, with weekly and monthly signals diverging across key metrics such as MACD, RSI, and moving averages.
Read full news article
Panorama Studios International Ltd is Rated Sell
Panorama Studios International Ltd is rated Sell by MarketsMOJO, with this rating last updated on 02 June 2026. However, the analysis and financial metrics discussed here reflect the stock’s current position as of 09 June 2026, providing investors with an up-to-date view of the company’s fundamentals, valuation, financial trends, and technical outlook.
Read full news article Announcements
Regulation 30 Of The SEBI (Listing Obligations And Disclosure Requirements) Regulations 2015 For Panorama Studios International Limited Has Executed A Line Producer Agreement With Big Box Series Private Limited For The Production And Exploitations Of A G
08-Jun-2026 | Source : BSEAs per Attachment.
Pursuant To Regulation 30 Read With Schedule III Of The SEBI (Listing Obligations And Disclosure Requirements) Regulations 2015 (SEBI Listing Regulations) As Amended From Time To Time We Are Pleased To Inform You That Panorama Studios International Limi
08-Jun-2026 | Source : BSEAs per Attachment
Announcement under Regulation 30 (LODR)-Newspaper Publication
01-Jun-2026 | Source : BSENewspaper Publication of Result for March-2026
Corporate Actions

No Upcoming Board Meetings

Panorama Studios International Ltd has declared 10% dividend, ex-date: 23 Sep 25

Panorama Studios International Ltd has announced 2:10 stock split, ex-date: 31 Jul 24

Panorama Studios International Ltd has announced 5:2 bonus issue, ex-date: 05 Dec 25

No Rights history available
Quality key factors
Valuation key factors
Technicals key factors
 Technical Indicator Scale: Bearish, Mildly Bearish, Sideways, Mildly Bullish, Bullish Turned
 Shareholding Snapshot : Mar 2026
Shareholding Compare (%holding)
Promoters
26.5496
Held by 0 Schemes
Held by 3 FIIs (0.46%)
Kumar Mangat Rajaram Pathak (35.27%)
Anand Kamalnayan Pandit (1.85%)
15.13%
Quarterly Results Snapshot (Consolidated) - Mar'26 - QoQ

QoQ Growth in quarter ended Mar 2026 is 119.99% vs -62.15% in Dec 2025
QoQ Growth in quarter ended Mar 2026 is 2,327.50% vs -119.61% in Dec 2025
Half Yearly Results Snapshot (Consolidated) - Sep'25
Growth in half year ended Sep 2025 is 81.94% vs -4.35% in Sep 2024

Growth in half year ended Sep 2025 is -25.98% vs 35.10% in Sep 2024
Nine Monthly Results Snapshot (Consolidated) - Dec'25
YoY Growth in nine months ended Dec 2025 is 60.72% vs -2.96% in Dec 2024
YoY Growth in nine months ended Dec 2025 is -42.75% vs 11.75% in Dec 2024
Annual Results Snapshot (Consolidated) - Mar'26
YoY Growth in year ended Mar 2026 is -15.28% vs -17.16% in Mar 2025
YoY Growth in year ended Mar 2026 is -62.58% vs 9.92% in Mar 2025
About Panorama Studios International Ltd

Company Coordinates


