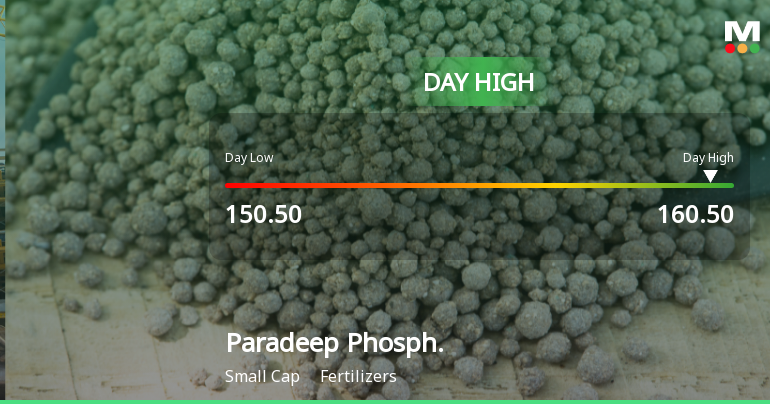
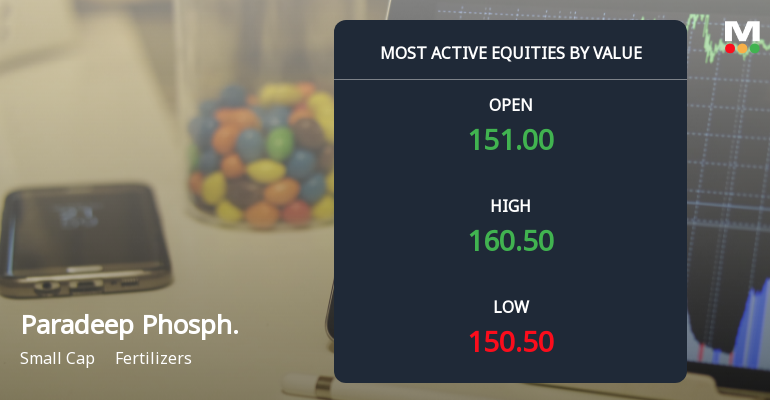
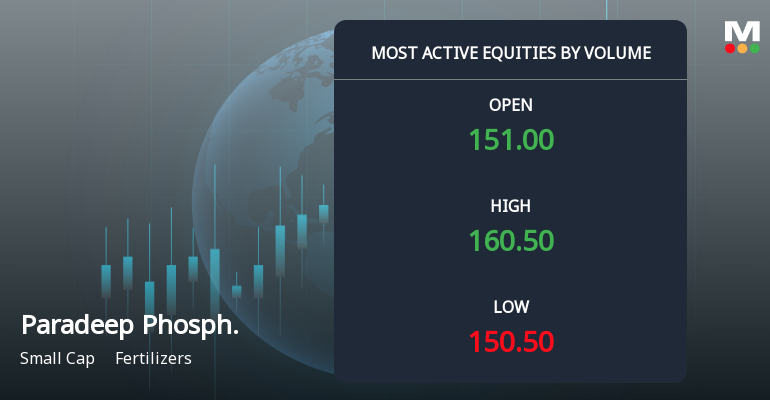
Paradeep Phosph.

  • Market Cap: Small Cap
  • Industry: Fertilizers
  • ISIN: INE088F01024
  • NSEID: PARADEEP
  • BSEID: 543530
INR
159.60
10.15 (6.79%)
BSENSE

Aug 25, 04:01 PM

BSE+NSE Vol: 5.44 cr

  • Price Points
  • Score
  • Mojo Parameters
  • Total Return
  • News and Corporate Actions
  • Key factors
  • Shareholding
  • Financials
  • CompanyCV
stock-summaryPrice Point
High/Low

1Day

52 Week

Valuation
Technical
Day's Volume

CASH

5.44 cr (1,917.82%) Volume

Shareholding (Jun 2026)

FII

5.10%

Held by 126 FIIs

DII

18.18%

Held by 49 DIIs

Promoter

57.86%

Why is Paradeep Phosphates Ltd falling/rising?

25-Aug-2026

As of 24-Aug, Paradeep Phosphates Ltd's stock price is rising to Rs 149.45, driven by a trend reversal, strong buying interest, and positive market sentiment. The company shows healthy long-term growth and increased investor participation, despite a negative annual return.

As of 24-Aug, Paradeep Phosphates Ltd's stock price is rising, currently at Rs 149.45, reflecting an increase of 1.1 (0.74%). This upward movement can be attributed to several factors. Firstly, the stock has shown a trend reversal, gaining after two consecutive days of decline. Additionally, it has outperformed its sector by 1.45% today, indicating positive market sentiment.<BR><BR>The stock reached an intraday high of Rs 151.85, which is a 2.36% increase, suggesting strong buying interest. Moreover, Paradeep Phosphates is trading above its 5-day, 20-day, 50-day, 100-day, and 200-day moving averages, which is typically a bullish signal for investors. There has also been a rise in investor participation, with delivery volume increasing by 2.23% against the 5-day average, indicating growing confidence among investors.<BR><BR>Financially, the company has demonstrated healthy long-term growth, with net sales increasing at an annual rate of 27.13% and operating profit rising at 31.44%. The latest six-month net sales stood at Rs 10,826.22 crore, reflecting a growth of 24.48%. Furthermore, the stock is trading at a discount compared to its peers' average historical valuations, which may attract more investors looking for value.<BR><BR>Despite the stock's negative performance over the past year, with a return of -32.11%, its profits have increased by 14%, showcasing resilience in its financials. High institutional holdings at 23.28% also suggest that informed investors are backing the stock, which can further bolster its price.<BR><BR>In summary, the combination of positive market performance today, strong financial growth indicators, and increased investor participation are contributing to the rising stock price of Paradeep Phosphates Ltd.

View full answer

Who are in the management team of Paradeep Phosph.?

14-Aug-2026

The management team of Paradeep Phosph. includes S K Poddar (Chairman), N Suresh Krishnan (Managing Director & CEO), and several non-executive and independent directors, along with Sachin Patil as Company Secretary.

The management team of Paradeep Phosph. includes the following individuals:<BR><BR>1. **S K Poddar** - Chairman (Non-Executive)<BR>2. **N Suresh Krishnan** - Managing Director & CEO<BR>3. **Soual Mohamed** - Non-Executive Director / Nomin<BR>4. **Karim Lotfi Senhadji** - Non-Executive Director<BR>5. **Satyananda Mishra** - Independent Non-Executive Director<BR>6. **Dipankar Chatterji** - Independent Non-Executive Director<BR>7. **Subhrakant Panda** - Independent Non-Executive Director<BR>8. **Rita Menon** - Independent Non-Executive Director<BR>9. **Sachin Patil** - Company Secretary & Compliance Officer<BR><BR>If you need any more details about their roles or the company, feel free to ask!

View full answer

What does Paradeep Phosph. do?

14-Aug-2026

Paradeep Phosphates Ltd is a leading Indian fertilizer company, incorporated in 1981, with recent net sales of ₹6,124 Cr and a net profit of ₹393 Cr as of June 2026. It operates in the small-cap segment with a market cap of ₹15,365 Cr and key metrics including a P/E of 14.00 and a dividend yield of 0.53%.

Overview:<BR>Paradeep Phosphates Ltd is a leading fertilizer company in India, operating in the small-cap segment of the fertilizers industry.<BR><BR>History:<BR>Incorporated in December 1981, Paradeep Phosphates Ltd has been primarily engaged in the manufacture of various fertilizers. The latest quarterly results reported net sales and net profit for June 2026.<BR><BR>Financial Snapshot:<BR>Most recent Net Sales: 6,124 Cr (Quarterly Results - Jun 2026) <BR>Most recent Net Profit: 393 Cr (Quarterly Results - Jun 2026) <BR>Market-cap value: INR 15,365 Cr (Small Cap)<BR><BR>Key Metrics:<BR>P/E: 14.00 <BR>Industry P/E: 22 <BR>Dividend Yield: 0.53% <BR>Debt-Equity: 0.96 <BR>Return on Equity: 15.14% <BR>Price-to-Book: 2.25 <BR><BR>Contact Details:<BR>No Company Details Available <BR>Registrar Address: Not available.

View full answer

Who are the peers of the Paradeep Phosph.?

14-Aug-2026

Paradeep Phosph.'s peers include Coromandel International, FACT, Deepak Fertilizers, Chambal Fertilizers, EID Parry, GNFC, RCF, GSFC, M B Agro Products, and Krishana Phosch. While Paradeep Phosph. has average management risk and below-average capital structure, its growth is rated as excellent, with a 1-year return of -29.13%.

Peers: The peers of Paradeep Phosph. are Coromandel Inter, F A C T, Deepak Fertilis., Chambal Fert., EID Parry, GNFC, RCF, GSFC, M B Agro Prod., and Krishana Phosch.<BR><BR>Quality Snapshot: Excellent management risk is observed at Coromandel Inter, Deepak Fertilis., Chambal Fert., EID Parry, GNFC, while Average management risk is found at F A C T, Paradeep Phosph., RCF, GSFC, M B Agro Prod., and Krishana Phosch. Growth is rated as Excellent for Paradeep Phosph., Deepak Fertilis., and M B Agro Prod., while Average growth is noted for Coromandel Inter, EID Parry, and the rest. Capital Structure is Excellent for Coromandel Inter, Chambal Fert., EID Parry, GNFC, and GSFC, while Below Average is seen at Paradeep Phosph., F A C T, RCF, and the rest.<BR><BR>Return Snapshot: The peer with the highest 1-year return is GNFC at 8.61%, while the lowest is F A C T at -17.00%. Paradeep Phosph.'s 1-year return is -29.13%, which is lower than both. Additionally, the six-month returns are negative for EID Parry, RCF, GSFC, and F A C T.

View full answer

How big is Paradeep Phosph.?

14-Aug-2026

As of 14th August, Paradeep Phosphates Ltd has a market capitalization of 15,344.16 Cr and reported net sales of 23,447.09 Cr and net profit of 1,072.14 Cr over the latest four quarters.

As of 14th August, <BR><BR>Market Cap: Paradeep Phosphates Ltd has a market capitalization of 15,344.16 Cr, categorizing it as a Small Cap company.<BR><BR>Recent Quarterly Performance: The sum of Net Sales for the latest 4 quarters is 23,447.09 Cr, while the sum of Net Profit for the same period is 1,072.14 Cr.<BR><BR>Balance Sheet Snapshot: The reporting period for the balance sheet is March 2025. Shareholder's Funds are valued at 4,076.88 Cr, and Total Assets amount to 11,146.33 Cr.

View full answer

Should I buy, sell or hold Paradeep Phosphates Ltd?

13-Aug-2026

When is the next results date for Paradeep Phosphates Ltd?

23-Jul-2026

The next results date for Paradeep Phosphates Ltd is July 28, 2026.

The next results date for Paradeep Phosphates Ltd is scheduled for July 28, 2026.

View full answer

Are Paradeep Phosphates Ltd latest results good or bad?

12-May-2026

Paradeep Phosphates Ltd's latest results are unfavorable, showing a 14.53% QoQ decline in net profit and an 18.21% QoQ drop in net sales, despite a 12.11% YoY sales growth. Rising interest costs and contracting profit margins indicate operational challenges that the company needs to address.

The latest results for Paradeep Phosphates Ltd indicate a challenging performance in Q4 FY26. The company reported a net profit of ₹155.60 crore, which represents a decline of 14.53% quarter-on-quarter (QoQ) and 9.63% year-on-year (YoY). Additionally, net sales decreased significantly by 18.21% QoQ, although they showed a year-on-year growth of 12.11%.<BR><BR>The profit after tax (PAT) margin also contracted to 3.31%, down from 3.97% QoQ and 4.11% YoY, reflecting pressure on profitability. A notable concern is the surge in interest costs, which reached ₹156.17 crore, marking the highest quarterly level for the company and increasing by 23.01% QoQ. This has resulted in a deteriorating interest coverage ratio, which fell to 2.83 times, indicating potential difficulties in servicing debt.<BR><BR>Overall, while there was some year-on-year revenue growth, the significant QoQ declines in both profit and sales, coupled with rising costs and margin compression, suggest that the latest results are not favorable. The company is facing operational challenges that need to be addressed to improve its financial health moving forward.

View full answer

Is Paradeep Phosph. technically bullish or bearish?

25-Nov-2025

As of November 24, 2025, the trend is mildly bullish due to daily moving averages, but caution is advised as weekly MACD and KST are bearish, despite a bullish weekly RSI and mixed signals from Bollinger Bands.

As of 24 November 2025, the technical trend has changed from sideways to mildly bullish. The current stance is mildly bullish, driven primarily by the daily moving averages indicating bullish momentum. However, the weekly MACD and KST are both mildly bearish, suggesting some caution. The weekly RSI is bullish, which supports the positive outlook, while the Bollinger Bands show mixed signals with a mildly bearish stance on the weekly and mildly bullish on the monthly. Overall, the strength of the bullish signal is tempered by the bearish indicators in the weekly timeframe.

View full answer

How has been the historical performance of Paradeep Phosph.?

24-Nov-2025

Paradeep Phosph. has exhibited significant growth in net sales and profitability, with net sales increasing from 4,192.87 crore in March 2020 to 13,820.21 crore in March 2025, and profit after tax rising from 99.24 crore to 662.85 crore in the same period. The company has also improved its operating profit margin and maintained positive cash flow, indicating robust financial performance.

Answer:<BR>The historical performance of Paradeep Phosph. shows significant growth in net sales and profitability over the years, particularly from 2021 to 2025.<BR><BR>Breakdown:<BR>Paradeep Phosph. has demonstrated a strong upward trend in net sales, increasing from 4,192.87 crore in March 2020 to 13,820.21 crore in March 2025, with a notable dip in March 2023 before rebounding. Total operating income followed a similar trajectory, reaching 13,820.21 crore in March 2025. The company's operating profit (PBDIT) also improved significantly, rising from 494.66 crore in March 2020 to 1,610.39 crore in March 2025, reflecting an operating profit margin of 10.58% in the latest fiscal year. Profit before tax surged to 4,053.84 crore in March 2025, compared to just 140.16 crore in March 2024, while profit after tax reached 662.85 crore, up from 99.24 crore the previous year. The total assets of the company increased from 5,010.32 crore in March 2020 to 11,146.33 crore in March 2025, with total liabilities also rising to 11,146.33 crore. Cash flow from operating activities remained positive, amounting to 1,386 crore in March 2025, contributing to a closing cash balance of 873 crore. Overall, Paradeep Phosph. has shown robust financial growth and improved operational efficiency over the years.

View full answer

Is Paradeep Phosph. overvalued or undervalued?

11-Nov-2025

As of November 10, 2025, Paradeep Phosph. is considered undervalued with a PE ratio of 13.97, a price-to-book value of 0.21, and an EV to EBITDA ratio of 25.52, significantly outperforming peers like Coromandel International and F A C T, and achieving a year-to-date return of 50.74% compared to the Sensex's 6.91%.

As of 10 November 2025, the valuation grade for Paradeep Phosph. has moved from expensive to attractive, indicating a significant shift in its market perception. The company is currently deemed undervalued, particularly when considering its price-to-earnings (PE) ratio of 13.97, a price-to-book value of 0.21, and an EV to EBITDA ratio of 25.52. These metrics suggest that Paradeep Phosph. is trading at a discount compared to its peers.<BR><BR>In comparison to its industry peers, Paradeep Phosph. stands out with a lower PE ratio than Coromandel International, which has a PE of 29.96, and significantly lower than F A C T, which has an exorbitant PE of 628.48. Additionally, its PEG ratio of 0.09 is notably more attractive than that of Chambal Fertilizers, which has a PEG of 0.48. The company's recent stock performance has also been impressive, with a year-to-date return of 50.74%, significantly outperforming the Sensex's 6.91% during the same period, reinforcing the notion that it is undervalued in the current market.

View full answer

Who are the top shareholders of the Paradeep Phosph.?

17-Jul-2025

The top shareholders of Paradeep Phosph. include Zuari Maroc Phosphates Private Limited with 56.05%, mutual funds holding 24.06%, and foreign institutional investors at 7.18%. Individual investors own 11.27%, with SBI Multicap Fund being the largest public shareholder at 8.67%.

The top shareholders of Paradeep Phosph. include a mix of promoters, mutual funds, and individual investors. The largest shareholder is Zuari Maroc Phosphates Private Limited, which holds 56.05% of the company. Promoters collectively hold a significant portion, with 14.225% of their holdings pledged. Mutual funds account for 24.06% of the shares, held by 15 different schemes, while foreign institutional investors (FIIs) hold 7.18% through 103 different entities. The highest public shareholder is SBI Multicap Fund, with a stake of 8.67%. Individual investors collectively own 11.27% of the shares.

View full answer

Has Paradeep Phosph. declared dividend?

06-Jun-2025

Yes, Paradeep Phosphates Ltd has declared a 5% dividend, amounting to ₹0.5 per share, with an ex-date of September 17, 2024. The company has shown strong total returns, particularly a 157.74% return over the past year.

Paradeep Phosphates Ltd has declared a 5% dividend.<BR><BR>Dividend Details:<BR>- Percentage announced: 5%<BR>- Amount per share: 0.5<BR>- Ex-date: 17 Sep 2024<BR><BR>Dividend Yield: 0.28%.<BR><BR>Total Returns by Period:<BR>In the last 6 months, the price return was 55.93%, with no dividend return, resulting in a total return of 55.93%.<BR><BR>Over the past year, the price return was 157.07%, with a dividend return of 0.67%, leading to a total return of 157.74%.<BR><BR>In the 2-year period, the price return stood at 196.46%, with a dividend return of 1.72%, culminating in a total return of 198.18%.<BR><BR>For the 3-year period, the price return was 298.05%, and the dividend return was 2.62%, resulting in a total return of 300.67%.<BR><BR>In the 4-year period, there was no price return and no dividend return, leading to a total return of 0.0%.<BR><BR>Over the last 5 years, there was also no price return and no dividend return, resulting in a total return of 0.0%.<BR><BR>Overall, Paradeep Phosphates Ltd has declared a dividend, which contributes to a modest dividend yield. The total returns over various periods show significant growth, particularly in the 1-year and 3-year spans, indicating strong performance despite some periods with no returns.

View full answer
iScoreScore
Click here to find our call on this stock
Strong Sell
Sell
Hold
Buy
Strong Buy

Dashboard

1

Healthy long term growth as Net Sales has grown by an annual rate of 27.13% and Operating profit at 31.44%

  • NET SALES(Latest six months) At Rs 10,826.22 cr has Grown at 24.48%
  • PBDIT(Q) Highest at Rs 720.23 cr.
  • PBT LESS OI(Q) Highest at Rs 482.79 cr.
2

With ROCE of 13.2, it has a Attractive valuation with a 1.7 Enterprise value to Capital Employed

3

High Institutional Holdings at 23.28%

stock-summaryMojo Parameters

Mojo Parameters

Loading Valuation Snapshot...

Stock DNA

stock-summary
Industry

Fertilizers

stock-summary
Market cap

INR 16,570 Cr (Small Cap)

stock-summary
P/E

14.00

stock-summary
Industry P/E

NA

stock-summary
Dividend Yield

0.00%

stock-summary
Debt Equity

0.96

stock-summary
Return on Equity

15.14%

stock-summary
Price to Book

2.30

Revenue and Profits:
Net Sales:
6,124 Cr
(Quarterly Results - Jun 2026)
Net Profit:
393 Cr
stock-summaryTotal Returns
Total Returns (Price + Dividend) stock-summary
Dividend Yield (0%)
TimePeriod
Price Return
Dividend Return
Total Return
3 Months
24.11%
1.18%
25.29%
6 Months
37.23%
1.25%
38.48%
1 Year
-29.05%
0.66%
-28.39%
2 Years
80.75%
3.60%
84.35%
3 Years
132.01%
4.80%
136.81%
4 Years
198.32%
5.11%
203.43%
5 Years
0%
0%
0.0%

Latest dividend: 1 per share ex-dividend date: Aug-22-2025

Risk Adjusted Returns v/s stock-summary
Returns Beta
Icon
Beta has not been calculated since enough price history is not available
stock-summaryNews & Corporate Actions

Announcements stock-summary

Disclosures under Reg. 31(1) and 31(2) of SEBI (SAST) Regulations 2011.

22-Aug-2026 | Source : BSE

The Exchange has received Disclosure under Regulation 31(1) and 31(2) of SEBI (Substantial Acquisition of Shares & Takeovers) Regulations 2011 on August 22 2026 for Zuari Maroc Phosphates Pvt Ltd

Announcement under Regulation 30 (LODR)-Analyst / Investor Meet - Intimation

21-Aug-2026 | Source : BSE

Investor meet intimation

Disclosure Under Regulation 30 Of SEBI (Listing Obligations And Disclosure Requirements) Regulations 2015

21-Aug-2026 | Source : BSE

Please find enclosed disclosure under Regulation 30 of SEBI (LODR) Regulations 2015

Corporate Actions stock-summary

stock-summary
BOARD MEETING

No Upcoming Board Meetings

stock-summary
DIVIDEND

Paradeep Phosphates Ltd has declared 15% dividend, ex-date: 04 Sep 26

stock-summary
SPLITS

No Splits history available

stock-summary
BONUS

No Bonus history available

stock-summary
RIGHTS

No Rights history available

stock-summaryKey Factors

Quality key factors stock-summary

Factor
Value
Sales Growth (5y)
27.13%
EBIT Growth (5y)
31.44%
EBIT to Interest (avg)
2.95
Debt to EBITDA (avg)
6.07
Net Debt to Equity (avg)
0.96
Sales to Capital Employed (avg)
1.47
Tax Ratio
25.04%
Dividend Payout Ratio
14.77%
Pledged Shares
15.33%
Institutional Holding
23.28%
ROCE (avg)
9.64%
ROE (avg)
11.09%

Valuation key factors

Factor
Value
P/E Ratio
14
Industry P/E
0
Price to Book Value
2.30
EV to EBIT
11.81
EV to EBITDA
9.63
EV to Capital Employed
1.66
EV to Sales
0.94
PEG Ratio
NA
Dividend Yield
NA
ROCE (Latest)
13.17%
ROE (Latest)
15.14%

Technicals key factors

Indicator
Weekly
Monthly
MACD
Bullish
Mildly Bearish
RSI
Bearish
No Signal
Bollinger Bands
Bullish
Bullish
Moving Averages
Bullish (Daily)
KST
Bullish
Mildly Bearish
Dow Theory
No Trend
No Trend
OBV
No Trend
No Trend
stock-summary Technical Indicator Scale: Bearish, Mildly Bearish, Sideways, Mildly Bullish, Bullish  Turned 
stock-summaryShareholding
Shareholding Snapshot : Jun 2026stock-summary
Shareholding Compare (%holding) stock-summary
Majority shareholders

Promoters

Pledged Promoter Holdings

15.3287

Mutual Funds

Held by 21 Schemes (17.83%)

FIIs

Held by 126 FIIs (5.1%)

Promoter with highest holding

Zuari Maroc Phosphates Private Limited (50.31%)

Highest Public shareholder

Sbi Multicap Fund (4%)

Individual Investors Holdings

15.32%

stock-summaryFinancial
[
  {
    "link": "quarterly",
    "btn_text": "All Quarterly Results",
    "header": "Quarterly Results Snapshot (Consolidated) - Jun'26 - QoQ",
    "rhs": [
      {
        "prefix": "Net Sales ",
        "suffix": "QoQ Growth in quarter ended Jun 2026 is 30.25% vs -18.21% in Mar 2026",
        "dir": 1
      },
      {
        "prefix": "Consolidated Net Profit ",
        "suffix": "QoQ Growth in quarter ended Jun 2026 is 152.28% vs -14.53% in Mar 2026",
        "dir": 1
      }
    ],
    "table": {
      "header": [
        "Jun'26",
        "Mar'26",
        "Change(%)"
      ],
      "body": [
        {
          "field": "Net Sales",
          "val1": "6,124.25",
          "val2": "4,701.97",
          "chgp": "30.25%",
          "chgp_class": "positive"
        },
        {
          "field": "Operating Profit (PBDIT) excl Other Income",
          "val1": "720.23",
          "val2": "442.44",
          "chgp": "62.79%",
          "chgp_class": "positive"
        },
        {
          "field": "Interest",
          "val1": "131.70",
          "val2": "156.17",
          "chgp": "-15.67%",
          "chgp_class": "positive"
        },
        {
          "field": "Exceptional Items",
          "val1": "21.80",
          "val2": "1.88",
          "chgp": "1,059.57%",
          "chgp_class": "positive"
        },
        {
          "field": "Consolidate Net Profit",
          "val1": "392.54",
          "val2": "155.60",
          "chgp": "152.28%",
          "chgp_class": "positive"
        },
        {
          "field": "Operating Profit Margin (Excl OI)",
          "val1": "11.76%",
          "val2": "9.41%",
          "chgp": "2.35%",
          "chgp_class": "positive"
        }
      ]
    }
  },
  {
    "link": "half-yearly",
    "btn_text": "All Half Yearly Results",
    "header": "Half Yearly Results Snapshot (Consolidated) - Sep'25",
    "rhs": [
      {
        "prefix": "Net Sales ",
        "suffix": " Growth in half year ended Sep 2025 is 46.31% vs 15.40% in Sep 2024",
        "dir": 1
      },
      {
        "prefix": "Consolidated Net Profit ",
        "suffix": " Growth in half year ended Sep 2025 is 134.74% vs 1,019.70% in Sep 2024",
        "dir": -1
      }
    ],
    "table": {
      "header": [
        "Sep'25",
        "Sep'24",
        "Change(%)"
      ],
      "body": [
        {
          "field": "Net Sales",
          "val1": "11,375.70",
          "val2": "7,775.14",
          "chgp": "46.31%",
          "chgp_class": "positive"
        },
        {
          "field": "Operating Profit (PBDIT) excl Other Income",
          "val1": "1,237.34",
          "val2": "729.49",
          "chgp": "69.62%",
          "chgp_class": "positive"
        },
        {
          "field": "Interest",
          "val1": "244.60",
          "val2": "221.00",
          "chgp": "10.68%",
          "chgp_class": "negative"
        },
        {
          "field": "Exceptional Items",
          "val1": "0.00",
          "val2": "0.00",
          "chgp": "",
          "chgp_class": "neutral"
        },
        {
          "field": "Consolidate Net Profit",
          "val1": "658.69",
          "val2": "280.60",
          "chgp": "134.74%",
          "chgp_class": "positive"
        },
        {
          "field": "Operating Profit Margin (Excl OI)",
          "val1": "10.88%",
          "val2": "9.38%",
          "chgp": "1.50%",
          "chgp_class": "positive"
        }
      ]
    }
  },
  {
    "link": "nine-monthly",
    "btn_text": "All Nine Monthly Results",
    "header": "Nine Monthly Results Snapshot (Consolidated) - Dec'25",
    "rhs": [
      {
        "prefix": "Net Sales ",
        "suffix": "YoY Growth in nine months ended Dec 2025 is 34.15% vs 36.78% in Dec 2024",
        "dir": -1
      },
      {
        "prefix": "Consolidated Net Profit ",
        "suffix": "YoY Growth in nine months ended Dec 2025 is 71.60% vs 524.84% in Dec 2024",
        "dir": -1
      }
    ],
    "table": {
      "header": [
        "Dec'25",
        "Dec'24",
        "Change(%)"
      ],
      "body": [
        {
          "field": "Net Sales",
          "val1": "17,124.37",
          "val2": "12,764.69",
          "chgp": "34.15%",
          "chgp_class": "positive"
        },
        {
          "field": "Operating Profit (PBDIT) excl Other Income",
          "val1": "1,709.83",
          "val2": "1,167.59",
          "chgp": "46.44%",
          "chgp_class": "positive"
        },
        {
          "field": "Interest",
          "val1": "371.61",
          "val2": "324.29",
          "chgp": "14.59%",
          "chgp_class": "negative"
        },
        {
          "field": "Exceptional Items",
          "val1": "-41.30",
          "val2": "0.00",
          "chgp": "",
          "chgp_class": "neutral"
        },
        {
          "field": "Consolidate Net Profit",
          "val1": "840.75",
          "val2": "489.94",
          "chgp": "71.60%",
          "chgp_class": "positive"
        },
        {
          "field": "Operating Profit Margin (Excl OI)",
          "val1": "9.98%",
          "val2": "9.15%",
          "chgp": "0.83%",
          "chgp_class": "positive"
        }
      ]
    }
  },
  {
    "link": "annual",
    "btn_text": "All Annual Results",
    "header": "Annual Results Snapshot (Consolidated) - Mar'26",
    "rhs": [
      {
        "prefix": "Net Sales ",
        "suffix": "YoY Growth in year ended Mar 2026 is 28.70% vs 46.51% in Mar 2025",
        "dir": -1
      },
      {
        "prefix": "Consolidated Net Profit ",
        "suffix": "YoY Growth in year ended Mar 2026 is 50.48% vs 562.73% in Mar 2025",
        "dir": -1
      }
    ],
    "table": {
      "header": [
        "Mar'26",
        "Mar'25",
        "Change(%)"
      ],
      "body": [
        {
          "field": "Net Sales",
          "val1": "21,826.34",
          "val2": "16,958.65",
          "chgp": "28.70%",
          "chgp_class": "positive"
        },
        {
          "field": "Operating Profit (PBDIT) excl Other Income",
          "val1": "2,152.27",
          "val2": "1,551.02",
          "chgp": "38.76%",
          "chgp_class": "positive"
        },
        {
          "field": "Interest",
          "val1": "527.78",
          "val2": "443.18",
          "chgp": "19.09%",
          "chgp_class": "negative"
        },
        {
          "field": "Exceptional Items",
          "val1": "-39.42",
          "val2": "0.00",
          "chgp": "",
          "chgp_class": "neutral"
        },
        {
          "field": "Consolidate Net Profit",
          "val1": "996.35",
          "val2": "662.13",
          "chgp": "50.48%",
          "chgp_class": "positive"
        },
        {
          "field": "Operating Profit Margin (Excl OI)",
          "val1": "9.86%",
          "val2": "9.15%",
          "chgp": "0.71%",
          "chgp_class": "positive"
        }
      ]
    }
  }
]

Quarterly Results Snapshot (Consolidated) - Jun'26 - QoQstock-summary

Jun'26
Mar'26
Change(%)
Net Sales
6,124.25
4,701.97
30.25%
Operating Profit (PBDIT) excl Other Income
720.23
442.44
62.79%
Interest
131.70
156.17
-15.67%
Exceptional Items
21.80
1.88
1,059.57%
Consolidate Net Profit
392.54
155.60
152.28%
Operating Profit Margin (Excl OI)
11.76%
9.41%
2.35%
Values in Rs Cr.
Direction Arrows
Net Sales

QoQ Growth in quarter ended Jun 2026 is 30.25% vs -18.21% in Mar 2026

Direction Arrows
Consolidated Net Profit

QoQ Growth in quarter ended Jun 2026 is 152.28% vs -14.53% in Mar 2026

Half Yearly Results Snapshot (Consolidated) - Sep'25stock-summary

Sep'25
Sep'24
Change(%)
Net Sales
11,375.70
7,775.14
46.31%
Operating Profit (PBDIT) excl Other Income
1,237.34
729.49
69.62%
Interest
244.60
221.00
10.68%
Exceptional Items
0.00
0.00
Consolidate Net Profit
658.69
280.60
134.74%
Operating Profit Margin (Excl OI)
10.88%
9.38%
1.50%
Values in Rs Cr.
Direction Arrows
Net Sales

Growth in half year ended Sep 2025 is 46.31% vs 15.40% in Sep 2024

Direction Arrows
Consolidated Net Profit

Growth in half year ended Sep 2025 is 134.74% vs 1,019.70% in Sep 2024

Nine Monthly Results Snapshot (Consolidated) - Dec'25stock-summary

Dec'25
Dec'24
Change(%)
Net Sales
17,124.37
12,764.69
34.15%
Operating Profit (PBDIT) excl Other Income
1,709.83
1,167.59
46.44%
Interest
371.61
324.29
14.59%
Exceptional Items
-41.30
0.00
Consolidate Net Profit
840.75
489.94
71.60%
Operating Profit Margin (Excl OI)
9.98%
9.15%
0.83%
Values in Rs Cr.
Direction Arrows
Net Sales

YoY Growth in nine months ended Dec 2025 is 34.15% vs 36.78% in Dec 2024

Direction Arrows
Consolidated Net Profit

YoY Growth in nine months ended Dec 2025 is 71.60% vs 524.84% in Dec 2024

Annual Results Snapshot (Consolidated) - Mar'26stock-summary

Mar'26
Mar'25
Change(%)
Net Sales
21,826.34
16,958.65
28.70%
Operating Profit (PBDIT) excl Other Income
2,152.27
1,551.02
38.76%
Interest
527.78
443.18
19.09%
Exceptional Items
-39.42
0.00
Consolidate Net Profit
996.35
662.13
50.48%
Operating Profit Margin (Excl OI)
9.86%
9.15%
0.71%
Values in Rs Cr.
Direction Arrows
Net Sales

YoY Growth in year ended Mar 2026 is 28.70% vs 46.51% in Mar 2025

Direction Arrows
Consolidated Net Profit

YoY Growth in year ended Mar 2026 is 50.48% vs 562.73% in Mar 2025

stock-summaryCompany CV
About Paradeep Phosphates Ltd stock-summary
stock-summary
Paradeep Phosphates Ltd
Small Cap
Fertilizers
Paradeep Phosphates Limited is a leading fertilizer company in India. The Company incorporated in December, 1981 is primarily engaged in the manufacture of Di-Ammonium Phosphate (DAP), Complex Fertilizers of NPK grades, and Zypmite (Gypsum based product) having its manufacturing facility at the port town of Paradeep, in the District Jagatsinghpur, Odisha. The Company is also involved in trading of fertilizers, ammonia, neutralized phospo gypsum, micronutrient and other materials.
Company Coordinates stock-summary
Icon
No Company Details Available