
Compare Parag Milk Foods with Similar Stocks
Total Returns (Price + Dividend) 
Latest dividend: 0.5045801526717557 per share ex-dividend date: Sep-07-2021
Risk Adjusted Returns v/s
Returns Beta

News

Parag Milk Foods Ltd Technical Momentum Shifts Amid Mixed Market Signals
Parag Milk Foods Ltd has experienced a notable shift in its technical momentum, moving from a sideways trend to a mildly bearish stance. Despite a modest daily price increase of 1.36%, the company’s technical indicators present a complex picture, with mixed signals from MACD, RSI, moving averages, and other momentum oscillators. This analysis delves into the recent technical parameter changes and what they imply for investors navigating the FMCG sector.
Read full news article
Parag Milk Foods Ltd is Rated Strong Sell
Parag Milk Foods Ltd is rated Strong Sell by MarketsMOJO. This rating was last updated on 06 July 2026, reflecting a reassessment of the stock’s outlook. However, the analysis and financial metrics discussed here represent the company’s current position as of 11 July 2026, providing investors with the latest insights into its performance and prospects.
Read full news article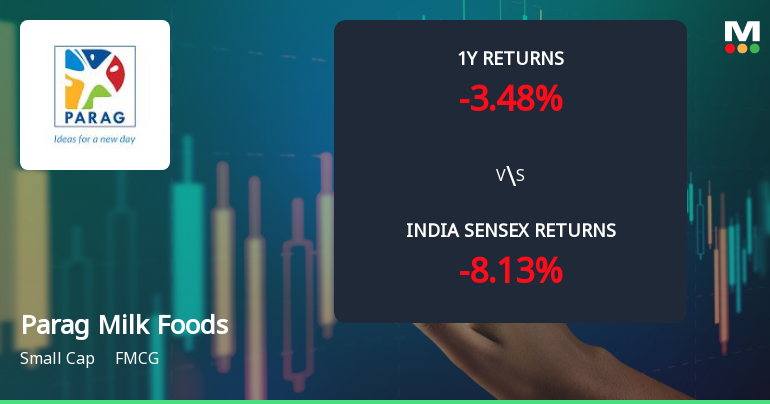
Parag Milk Foods Ltd Technical Momentum Shifts Amid Mixed Market Signals
Parag Milk Foods Ltd has experienced a notable shift in its technical momentum, transitioning from a mildly bearish stance to a sideways trend. Despite a modest day gain of 1.62%, the stock’s technical indicators present a complex picture, with mixed signals across weekly and monthly timeframes, reflecting uncertainty in the FMCG sector’s current dynamics.
Read full news article Announcements
Parag Milk Foods Limited - Updates
09-Dec-2019 | Source : NSEParag Milk Foods Limited has informed the Exchange regarding 'Parag Milk Foods Limited Intimation of Change in Name of Registrar & Share Transfer Agent of the Company from Karvy Fintech Private Limited to KFIN Technologies Private Limited
Parag Milk Foods Limited - Analysts/Institutional Investor Meet/Con. Call Updates
21-Nov-2019 | Source : NSEParag Milk Foods Limited has informed the Exchange regarding Analysts/Institutional Investor Meet/Con. Call Updates
Parag Milk Foods Limited - Updates
18-Nov-2019 | Source : NSEParag Milk Foods Limited has informed the Exchange regarding 'Parag Milk Foods Limited Disclosure Pursuant to Regulation 7(2) of SEBI (PIT) Regulations,, 2015'.
Corporate Actions

No Upcoming Board Meetings

Parag Milk Foods Ltd has declared 10% dividend, ex-date: 22 Sep 25

No Splits history available

No Bonus history available

No Rights history available
Quality key factors
Valuation key factors
Technicals key factors
 Technical Indicator Scale: Bearish, Mildly Bearish, Sideways, Mildly Bullish, Bullish Turned
 Shareholding Snapshot : Mar 2026
Shareholding Compare (%holding)
Non Institution
None
Held by 1 Schemes (0.0%)
Held by 50 FIIs (8.77%)
Devendra Prakash Shah (16.15%)
International Finance Corporation (4.58%)
28.46%
Quarterly Results Snapshot (Consolidated) - Mar'26 - YoY

YoY Growth in quarter ended Mar 2026 is 2.95% vs 16.22% in Mar 2025
YoY Growth in quarter ended Mar 2026 is 23.01% vs 166.90% in Mar 2025
Half Yearly Results Snapshot (Consolidated) - Sep'25

Growth in half year ended Sep 2025 is 14.13% vs 5.27% in Sep 2024
Growth in half year ended Sep 2025 is 29.59% vs 21.24% in Sep 2024
Nine Monthly Results Snapshot (Consolidated) - Dec'25
YoY Growth in nine months ended Dec 2025 is 14.25% vs 7.04% in Dec 2024
YoY Growth in nine months ended Dec 2025 is 11.04% vs 14.62% in Dec 2024
Annual Results Snapshot (Consolidated) - Mar'26
YoY Growth in year ended Mar 2026 is 11.23% vs 9.35% in Mar 2025
YoY Growth in year ended Mar 2026 is 13.69% vs 31.13% in Mar 2025
About Parag Milk Foods Ltd

Company Coordinates


