
Compare Paragon Finance with Similar Stocks
Dashboard
With a Operating Losses, the company has a Weak Long Term Fundamental Strength
- Poor long term growth as Net Sales has grown by an annual rate of -16.02% and Operating profit at -188.73%
- PAT(Q) At Rs -4.88 cr has Fallen at -763.9% (vs previous 4Q average)
- PBDIT(Q) Lowest at Rs -1.49 cr.
- PBT LESS OI(Q) Lowest at Rs -1.56 cr.
Risky - Negative EBITDA
Stock DNA
Non Banking Financial Company (NBFC)
INR 23 Cr (Micro Cap)
NA (Loss Making)
20
0.00%
0.05
-3.91%
0.73
Total Returns (Price + Dividend) 
Paragon Finance for the last several years.
Risk Adjusted Returns v/s
Returns Beta

News
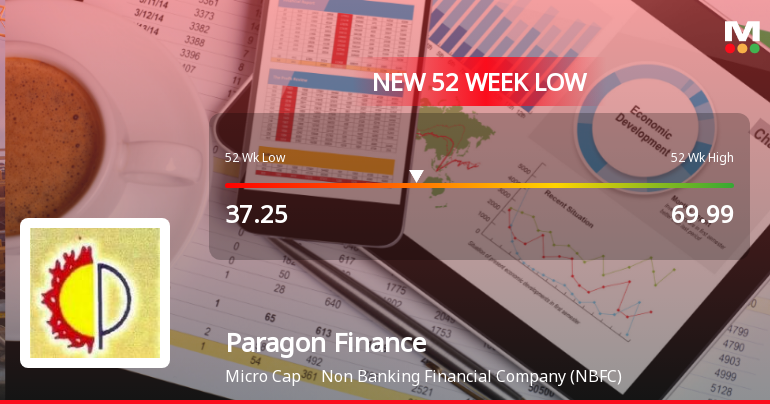
Paragon Finance Ltd Falls to 52-Week Low of Rs 37.25 as Sell-Off Deepens
A sharp decline in Paragon Finance Ltd saw the stock hit a fresh 52-week low of Rs 37.25 on 8 Jun 2026, marking a significant 46.7% drop from its 52-week high of Rs 69.99. Despite a volatile session where the stock rebounded intraday to Rs 49.5, the overall trend remains firmly downward, reflecting mounting concerns over the company’s financial health and market positioning.
Read full news article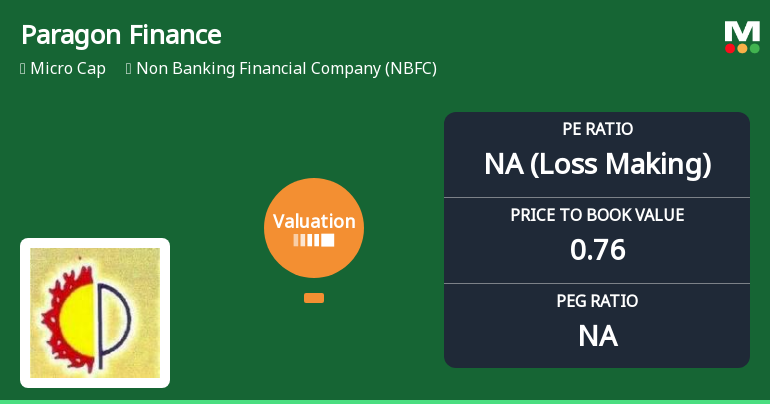
Paragon Finance Ltd Valuation Shifts Signal Elevated Risk Amid Market Challenges
Paragon Finance Ltd, a micro-cap player in the Non Banking Financial Company (NBFC) sector, has witnessed a marked deterioration in its valuation parameters, shifting from previously attractive levels to a risky territory. This change, coupled with a recent downgrade in its Mojo Grade to Strong Sell, underscores growing investor concerns amid subdued financial performance and challenging market conditions.
Read full news articleAre Paragon Finance Ltd latest results good or bad?
Paragon Finance Ltd's latest financial results for Q4 FY26 indicate significant operational challenges. The company reported a net profit of -₹4.88 crores, marking a substantial decline from the previous quarter, while net sales also turned negative at -₹0.90 crores, contrasting sharply with the positive sales recorded in Q3 FY26. This quarter's performance is characterized by extreme volatility, with net sales experiencing a quarter-on-quarter change of -198.90% and net profit reflecting a change of -371.11%. The operational metrics reveal a concerning trend, as the operating profit before depreciation, interest, and tax (PBDIT) fell to negative ₹5.62 crores, down from a positive ₹2.26 crores in the prior quarter. This decline was primarily driven by a significant drop in other income, which plummeted to negative ₹4.13 crores, suggesting potential write-offs or losses. Even when excluding other income, th...
Read full news article Announcements
Compliances-Reg.24(A)-Annual Secretarial Compliance
15-May-2026 | Source : BSEAnnual Secretarial Compliance Report for the Financial year ended March 31 2026.
Announcement under Regulation 30 (LODR)-Newspaper Publication
15-May-2026 | Source : BSENewspaper publication of Financial Results for the Quarter and Year ended March 31 2026.
Integrated Filing (Financial).
14-May-2026 | Source : BSEAudited Financial Results for the quarter and year ended March 31 2026.
Corporate Actions

No Upcoming Board Meetings

No Dividend history available

No Splits history available

No Bonus history available

No Rights history available
Quality key factors
Valuation key factors
Technicals key factors
 Technical Indicator Scale: Bearish, Mildly Bearish, Sideways, Mildly Bullish, Bullish Turned
 Shareholding Snapshot : Mar 2026
Shareholding Compare (%holding)
Promoters
None
Held by 0 Schemes
Held by 0 FIIs
Mahant Vanijya Pvt Ltd (19.24%)
Siphon Marketing Pvt. Ltd. (2.94%)
14.04%
Quarterly Results Snapshot (Standalone) - Mar'26 - QoQ

QoQ Growth in quarter ended Mar 2026 is -198.90% vs 435.29% in Dec 2025
QoQ Growth in quarter ended Mar 2026 is -371.11% vs 221.43% in Dec 2025
Half Yearly Results Snapshot (Standalone) - Sep'25
Growth in half year ended Sep 2025 is -42.13% vs 34.16% in Sep 2024
Growth in half year ended Sep 2025 is 37.06% vs 58.89% in Sep 2024
Nine Monthly Results Snapshot (Standalone) - Dec'25

YoY Growth in nine months ended Dec 2025 is 11.34% vs -29.71% in Dec 2024
YoY Growth in nine months ended Dec 2025 is 232.74% vs 175.61% in Dec 2024
Annual Results Snapshot (Standalone) - Mar'26
YoY Growth in year ended Mar 2026 is -42.73% vs -37.85% in Mar 2025
YoY Growth in year ended Mar 2026 is -458.06% vs -63.95% in Mar 2025
About Paragon Finance Ltd

Company Coordinates


