
Compare TCI Finance with Similar Stocks
Stock DNA
Non Banking Financial Company (NBFC)
INR 19 Cr (Micro Cap)
6.00
9
0.00%
-0.02
-4.60%
-0.27
Total Returns (Price + Dividend) 
TCI Finance for the last several years.
Risk Adjusted Returns v/s
Returns Beta

News
Are TCI Finance Ltd latest results good or bad?
TCI Finance Ltd's latest financial results indicate a challenging operational environment. For Q2 FY26, the company reported a net loss of ₹0.38 crores, which reflects a marginal sequential improvement from the previous quarter's loss of ₹0.42 crores. However, when compared year-on-year, the losses have widened significantly by 80.95% from ₹0.21 crores in Q2 FY25, highlighting a concerning trend of deteriorating financial performance. The company continues to report zero sales, consistent with previous quarters, indicating a complete cessation of revenue-generating activities. This lack of operational income has led to persistent operating losses, with the operating profit before depreciation, interest, and tax (PBDIT) also reflecting a loss of ₹0.38 crores in the latest quarter. Employee costs remain a primary expense, totaling ₹0.23 crores, while the absence of interest expenses suggests a debt-free stat...
Read full news article
TCI Finance Ltd Hits Lower Circuit Amid Heavy Selling Pressure
Shares of TCI Finance Ltd, a micro-cap Non Banking Financial Company (NBFC), plunged to their lower circuit limit on 11 Feb 2026, closing at ₹15.52, down 4.96% from the previous close. The sharp decline was driven by intense selling pressure, unfilled supply, and a marked drop in investor participation, signalling a wave of panic selling in the stock.
Read full news article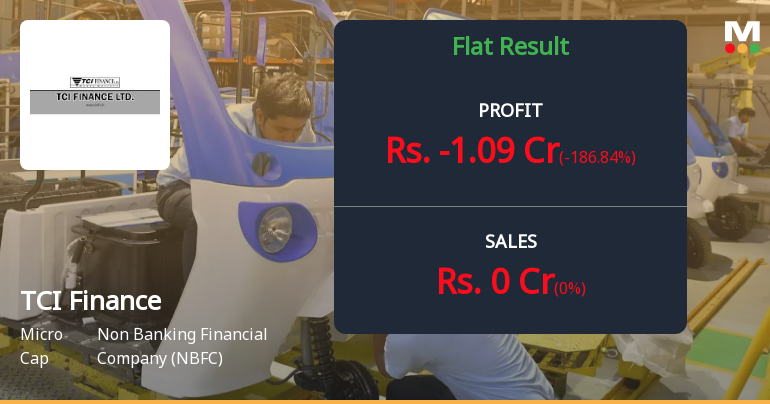
TCI Finance Q2 FY26: Mounting Losses Signal Deepening Distress for Micro-Cap NBFC
TCI Finance Ltd., a micro-cap non-banking financial company with a market capitalisation of just ₹20.00 crores, reported another quarter of losses in Q2 FY26, with net profit standing at a loss of ₹0.38 crores. The loss narrowed marginally from ₹0.42 crores in Q1 FY26, but widened substantially on a year-on-year basis, deteriorating 80.95% from a loss of ₹0.21 crores in Q2 FY25. The stock, trading at ₹16.30, reflects the company's precarious financial position with a negative book value per share of ₹-52.95, painting a concerning picture for investors.
Read full news article Announcements
Tci Finance Limited - Other General Purpose
09-Dec-2019 | Source : NSETci Finance Limited has informed the Exchange regarding Disclosure of Related Party Transaction under Regulation 23(9) of the SEBI (Listing Obligations and Disclosure Requirements) Regulations, 2015.
Tci Finance Limited - Updates
27-Nov-2019 | Source : NSETci Finance Limited has informed the Exchange regarding 'Announcement under Regulation 30 (LODR)-Newspaper Publication'.
Tci Finance Limited - Outcome of Board Meeting
08-Nov-2019 | Source : NSETci Finance Limited has informed the Exchange regarding Outcome of Board Meeting held on November 08, 2019.
Corporate Actions

No Upcoming Board Meetings

No Dividend history available

No Splits history available

No Bonus history available

No Rights history available
Quality key factors
Valuation key factors
Technicals key factors
 Technical Indicator Scale: Bearish, Mildly Bearish, Sideways, Mildly Bullish, Bullish Turned
 Shareholding Snapshot : Dec 2025
Shareholding Compare (%holding)
Non Institution
None
Held by 0 Schemes
Held by 0 FIIs
Giri Roadlines And Commercial Trading Pvt. Ltd. (9.47%)
None
63.07%
Quarterly Results Snapshot (Standalone) - Dec'25 - QoQ
QoQ Growth in quarter ended Dec 2025 is 0.00% vs 0.00% in Sep 2025

QoQ Growth in quarter ended Dec 2025 is -186.84% vs 9.52% in Sep 2025
Half Yearly Results Snapshot (Standalone) - Sep'25

Growth in half year ended Sep 2025 is 0.00% vs -100.00% in Sep 2024
Growth in half year ended Sep 2025 is -12.68% vs -173.08% in Sep 2024
Nine Monthly Results Snapshot (Standalone) - Dec'25
YoY Growth in nine months ended Dec 2025 is 0.00% vs -100.00% in Dec 2024
YoY Growth in nine months ended Dec 2025 is -98.95% vs -9,600.00% in Dec 2024
Annual Results Snapshot (Standalone) - Mar'25
YoY Growth in year ended Mar 2025 is -100.00% vs 0.00% in Mar 2024
YoY Growth in year ended Mar 2025 is 845.83% vs 80.88% in Mar 2024
About TCI Finance Ltd

Company Coordinates


