
Dashboard
With ROE of 9.2, it has a Very Expensive valuation with a 10.3 Price to Book Value
- The stock is trading at a discount compared to its peers' average historical valuations
- Over the past year, while the stock has generated a return of -12.67%, its profits have risen by 111.2% ; the PEG ratio of the company is 1
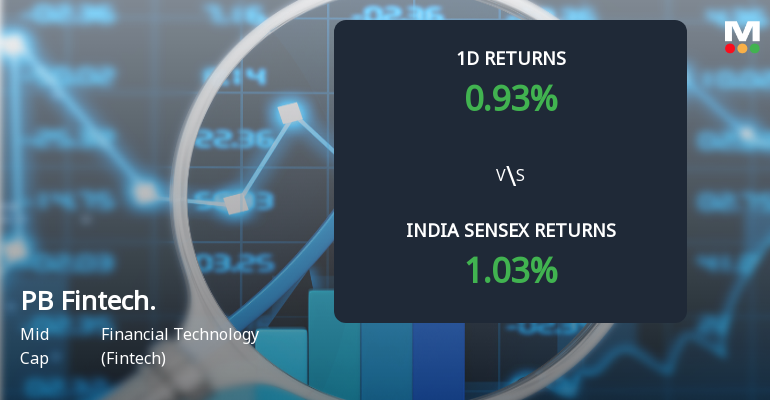
Underperformed the market in the last 1 year
Stock DNA
Financial Technology (Fintech)
INR 74,170 Cr (Mid Cap)
113.00
21
0.00%
0.05
9.16%
10.28
Total Returns (Price + Dividend) 
PB Fintech. for the last several years.
Risk Adjusted Returns v/s
Returns Beta

News
PB Fintech Ltd Sees Sharp Open Interest Surge Amid Mixed Market Signals
PB Fintech Ltd (POLICYBZR) has witnessed a notable 17.4% increase in open interest in its derivatives segment, signalling heightened market activity and shifting investor positioning. Despite a modest 0.94% gain in the stock price, the surge in open interest alongside volume patterns suggests evolving directional bets amid a backdrop of mixed technical indicators and falling investor participation.
Read full news article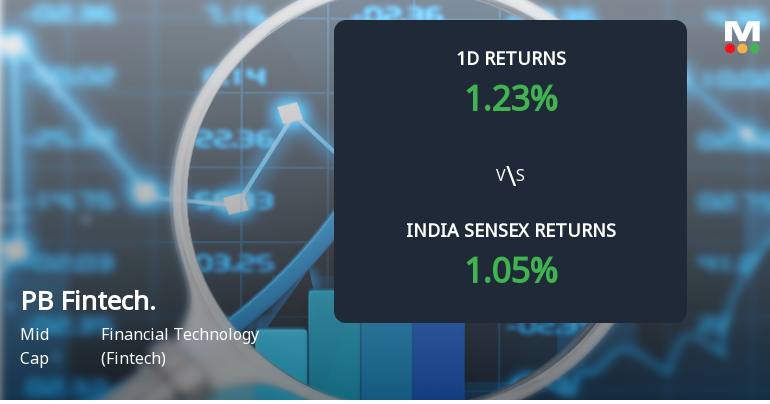
PB Fintech Ltd Sees Significant Open Interest Surge Amid Mixed Market Signals
PB Fintech Ltd (POLICYBZR) has witnessed a notable 15.23% increase in open interest in its derivatives segment, signalling heightened market activity and shifting positioning among traders. Despite a modest 1.04% gain in the stock price, the surge in open interest and volume patterns suggest evolving directional bets that merit close attention from investors and analysts alike.
Read full news article
PB Fintech Ltd Sees Sharp Open Interest Surge Amid Mixed Market Signals
PB Fintech Ltd (POLICYBZR) has witnessed a notable 14.06% increase in open interest in its derivatives segment, signalling heightened market activity and shifting investor positioning. Despite a modest 0.96% gain in the stock price, the surge in open interest alongside volume patterns suggests evolving directional bets amid a backdrop of mixed technical and fundamental indicators.
Read full news article Announcements
Announcement under Regulation 30 (LODR)-Analyst / Investor Meet - Intimation
22-Jun-2026 | Source : BSEPease find enclosed the Intimation of Analyst Meet scheduled to be held on June 29 2026.
Announcement under Regulation 30 (LODR)-Cessation
19-Jun-2026 | Source : BSEPlease find enclosed the intimation under Regulation 30 of SEBI (LODR) Regulations 2015
Announcement under Regulation 30 (LODR)-Change in Directorate
19-Jun-2026 | Source : BSEPlease find enclosed the intimation under Regulation 30 of SEBI (LODR) Regulations 2015
Corporate Actions

No Upcoming Board Meetings

No Dividend history available

No Splits history available

No Bonus history available

No Rights history available
Quality key factors
Valuation key factors
Technicals key factors
 Technical Indicator Scale: Bearish, Mildly Bearish, Sideways, Mildly Bullish, Bullish Turned
 Shareholding Snapshot : Mar 2026
Shareholding Compare (%holding)
FIIs
None
Held by 39 Schemes (25.94%)
Held by 769 FIIs (39.94%)
None
Info Edge (india) Limited (6.47%)
4.22%
Quarterly Results Snapshot (Consolidated) - Mar'26 - QoQ

QoQ Growth in quarter ended Mar 2026 is 16.38% vs 9.77% in Dec 2025

QoQ Growth in quarter ended Mar 2026 is 37.88% vs 40.43% in Dec 2025
Half Yearly Results Snapshot (Consolidated) - Sep'25
Growth in half year ended Sep 2025 is 35.99% vs 47.42% in Sep 2024
Growth in half year ended Sep 2025 is 97.93% vs 450.19% in Sep 2024
Nine Monthly Results Snapshot (Consolidated) - Dec'25
YoY Growth in nine months ended Dec 2025 is 36.41% vs 47.75% in Dec 2024
YoY Growth in nine months ended Dec 2025 is 124.18% vs 2,753.99% in Dec 2024
Annual Results Snapshot (Consolidated) - Mar'26
YoY Growth in year ended Mar 2026 is 36.50% vs 44.78% in Mar 2025
YoY Growth in year ended Mar 2026 is 90.29% vs 425.63% in Mar 2025
About PB Fintech Ltd

Company Coordinates


