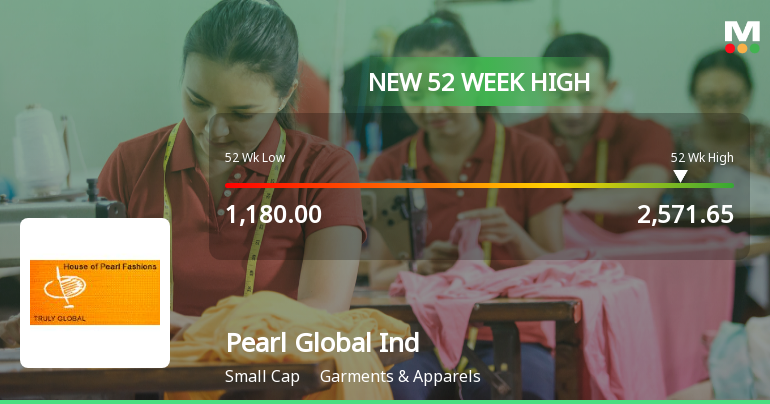
Pearl Global Ind

  • Market Cap: Small Cap
  • Industry: Garments & Apparels
  • ISIN: INE940H01022
  • NSEID: PGIL
  • BSEID: 532808
INR
2,294.40
4.8 (0.21%)
BSENSE

Aug 27, 03:17 PM

BSE+NSE Vol: 53.95 k

  • Price Points
  • Score
  • Mojo Parameters
  • Total Return
  • News and Corporate Actions
  • Key factors
  • Shareholding
  • Financials
  • CompanyCV
stock-summaryPrice Point
High/Low

1Day

52 Week

Valuation
Technical
Day's Volume

CASH

53.95 k (-65.22%) Volume

Shareholding (Jun 2026)

FII

6.82%

Held by 96 FIIs

DII

19.16%

Held by 20 DIIs

Promoter

61.11%

Why is Pearl Global Industries Ltd falling/rising?

27-Aug-2026

As of 26-Aug, Pearl Global Industries Ltd's stock price is declining, currently at 2,285.95, with a 1.48% decrease and a 4.25% loss over the past five days. Despite strong fundamentals, concerns over valuation and reduced investor participation are contributing to the stock's downward trend.

As of 26-Aug, Pearl Global Industries Ltd's stock price is falling, currently at 2,285.95, reflecting a decrease of 34.3 or 1.48%. The stock has been on a downward trend, having lost 4.25% over the last five days, and it has underperformed its sector by 0.69% today. Additionally, the stock has experienced consecutive declines for five days, indicating a sustained negative momentum.<BR><BR>Investor participation has also decreased, with delivery volume dropping by 14.24% compared to the five-day average, suggesting a lack of buying interest. Although the stock remains above its 20-day, 50-day, 100-day, and 200-day moving averages, it is lower than its 5-day moving average, which may indicate short-term weakness.<BR><BR>Despite the company's strong fundamentals, such as a high return on capital employed (ROCE) of 20.00% and significant growth in net sales and operating profit, the stock's valuation appears expensive with a PEG ratio of 1.4. This could be contributing to the current selling pressure as investors reassess the stock's price relative to its earnings growth. Overall, the combination of recent performance, declining investor participation, and valuation concerns are key factors driving the stock's current decline.

View full answer

Which are the latest news on Pearl Global Ind?

27-Aug-2026

Who are in the management team of Pearl Global Ind?

14-Aug-2026

The management team of Pearl Global Industries includes key members such as Deepak Seth (Chairman), Pulkit Seth (Vice Chairman & Managing Director), and several independent directors, whole-time directors, and company secretaries, bringing diverse expertise to the company.

The management team of Pearl Global Industries includes the following key members:<BR><BR>1. **Deepak Seth** - Chairman<BR>2. **Pulkit Seth** - Vice Chairman & Managing Director<BR>3. **C R Dua** - Independent Director<BR>4. **Rajendra Kumar Aneja** - Independent Director<BR>5. **Sandeep Sabharwal** - Company Secretary<BR>6. **Shefali Seth** - Whole-time Director<BR>7. **Vinod Vaish** - Whole-time Director<BR>8. **Anil Nayar** - Independent Director<BR>9. **Abhishek Goyal** - Independent Director<BR>10. **Madhulika Bhupatkar** - Additional Independent Director<BR>11. **Shaileash Kumar** - Executive Director<BR>12. **Mayank Jain** - Company Secretary<BR>13. **Neha Khanna** - Director<BR>14. **Deepak Kumar** - Whole-time Director & Additional Director<BR>15. **Pallab Banerjee** - Managing Director<BR>16. **Shefali Seth** - Non-Executive Director<BR><BR>This diverse team brings a mix of expertise and leadership to the company.

View full answer

What does Pearl Global Ind do?

14-Aug-2026

Pearl Global Industries Ltd operates in the Garments & Apparels industry as a Small Cap company, reporting net sales of ₹1,528 Cr and a net profit of ₹101 Cr for June 2026. The company, formerly known as House of Pearl Fashions, has a market cap of ₹11,455 Cr and key metrics including a P/E of 36.00 and a dividend yield of 0.58%.

Overview:<BR>Pearl Global Industries Ltd operates in the Garments & Apparels industry and is categorized as a Small Cap company.<BR><BR>History:<BR>The company was initially incorporated as 'Minia Estates Private Limited' in 1989, later changing its name to 'House of Pearl Fashions Private Limited' in 2006. It became a public company and was renamed 'House of Pearl Fashions Limited' before finally adopting the name 'Pearl Global Industries Limited' in 2012. The latest quarterly results reported net sales and net profit for June 2026.<BR><BR>Financial Snapshot:<BR>- Net Sales: 1,528 Cr (Quarterly Results - Jun 2026)<BR>- Net Profit: 101 Cr (Quarterly Results - Jun 2026)<BR>- Market Cap: INR 11,455 Cr (Small Cap)<BR><BR>Key Metrics:<BR>- P/E: 36.00<BR>- Industry P/E: 28<BR>- Dividend Yield: 0.58%<BR>- Debt-Equity: 0.13<BR>- Return on Equity: 19.09%<BR>- Price to Book: 7.86<BR><BR>Contact Details:<BR>Address: A-3 Community Centre Phase II, Naraina Industrial Area New Delhi New Delhi : 110028<BR>Email: investor.pgil@pearlglobal.com<BR>Website: http://www.pearlglobal.com

View full answer

Who are the peers of the Pearl Global Ind?

14-Aug-2026

Pearl Global Ind's peers include Vardhman Textile, Welspun Living, Arvind Ltd, Vedant Fashions, Trident, V2 Retail, Indo Count Inds., Garware Tech, and Aditya Bir. Fas. In terms of performance, Pearl Global Ind shows excellent growth and a 1-year return of 96.95%, outperforming its peers.

Peers: The peers of Pearl Global Ind are Vardhman Textile, Welspun Living, Arvind Ltd, Vedant Fashions, Trident, V2 Retail, Indo Count Inds., Garware Tech, and Aditya Bir. Fas.<BR><BR>Quality Snapshot: Excellent management risk is observed at Vedant Fashions, while Good management risk is found at Pearl Global Ind, Vardhman Textile, Welspun Living, Arvind Ltd, Indo Count Inds., Garware Tech, and the rest. Average management risk is present at Trident and V2 Retail, while Aditya Bir. Fas. has a rating of Below Average. In terms of Growth, Excellent growth is noted at Pearl Global Ind and V2 Retail, while Good growth is found at Arvind Ltd, and the rest show Below Average growth. For Capital Structure, Excellent is seen at Vardhman Textile and Vedant Fashions, Good at Pearl Global Ind, Indo Count Inds., and Garware Tech, Average at Welspun Living and Arvind Ltd, and Below Average at V2 Retail and Aditya Bir. Fas.<BR><BR>Return Snapshot: Pearl Global Ind has a 1-year return of 96.95%, which is higher than Vardhman Textile's 46.94%, the highest among peers, and significantly above Aditya Bir. Fas.'s -24.03%, the lowest. Additionally, Trident, Garware Tech, and Aditya Bir. Fas. have negative six-month returns.

View full answer

How big is Pearl Global Ind?

14-Aug-2026

As of 14th August, Pearl Global Industries Ltd has a market capitalization of 11,433.31 Cr and reported net sales of 5,324.95 Cr and net profit of 310.35 Cr over the latest four quarters.

As of 14th August, <BR><BR>Market Cap: Pearl Global Industries Ltd has a market capitalization of 11,433.31 Cr, classified as Small Cap.<BR><BR>Recent Quarterly Performance: The sum of Net Sales for the latest 4 quarters is 5,324.95 Cr, while the sum of Net Profit for the same period is 310.35 Cr.<BR><BR>Balance Sheet Snapshot: The reporting period for the latest annual data is March 2026. Shareholder's Funds stand at 1,459.81 Cr, and Total Assets amount to 3,224.91 Cr.

View full answer

Should I buy, sell or hold Pearl Global Industries Ltd?

07-Aug-2026

Are Pearl Global Industries Ltd latest results good or bad?

16-May-2026

Pearl Global Industries Ltd's latest results are good, with a 22.01% increase in net profit and a 6.88% rise in net sales for the quarter ending March 2026. The positive market reaction and improved operating margins indicate strong operational performance, despite the stock trading below its 52-week high.

Pearl Global Industries Ltd's latest results can be considered good overall. In the quarter ending March 2026, the company reported a consolidated net profit of ₹83.26 crore, which represents a 22.01% increase year-on-year. Additionally, net sales reached ₹1,313.58 crore, marking a 6.88% growth compared to the same period last year.<BR><BR>One of the standout achievements for this quarter is the operating margin, which expanded to 10.24%, the highest in seven quarters. This improvement reflects effective cost management and operational efficiencies. The company's profit after tax margin also increased to 6.16%, showing its ability to convert revenue into profit effectively.<BR><BR>The stock market reacted positively to these results, with a notable surge of 9.33% on the day following the announcement, indicating strong investor confidence. However, it's important to note that the stock is still trading 15.87% below its 52-week high, suggesting there may be room for growth.<BR><BR>Overall, while there are some signs of slowing growth compared to previous periods, the operational improvements and positive market response suggest that Pearl Global Industries is on a solid path.

View full answer

Is Pearl Global Ind overvalued or undervalued?

19-Nov-2025

As of November 18, 2025, Pearl Global Ind is considered overvalued with a PE ratio of 29.37 and an EV to EBITDA of 17.78, indicating a shift from fair to expensive valuation despite strong past performance compared to the Sensex.

As of 18 November 2025, the valuation grade for Pearl Global Ind has moved from fair to expensive, indicating a shift towards overvaluation. The company is currently assessed as overvalued based on key ratios, including a PE ratio of 29.37, an EV to EBITDA of 17.78, and a Price to Book Value of 6.01. These figures suggest that the stock is trading at a premium compared to its earnings and book value.<BR><BR>In comparison to its peers, Pearl Global Ind's PE ratio is notably higher than Vardhman Textile, which has a PE of 15.62, and lower than K P R Mill Ltd, which is classified as very expensive at 45.81. The PEG ratio of 1.19 further supports the overvaluation assessment, especially when compared to Trident's more attractive PEG of 0.86. Additionally, while Pearl Global Ind has outperformed the Sensex significantly over various periods, including a 63.21% return over the last year compared to the Sensex's 9.48%, the current valuation metrics suggest that the stock may not provide the same level of growth moving forward.

View full answer

Is Pearl Global Ind technically bullish or bearish?

17-Nov-2025

As of November 14, 2025, the trend is bullish with strong indicators like the weekly MACD and Bollinger Bands supporting this view, despite some caution from the monthly MACD and KST.

As of 14 November 2025, the technical trend has changed from mildly bullish to bullish. The current stance is bullish with strong indicators supporting this view. The weekly MACD is bullish, and both the weekly and monthly Bollinger Bands are bullish. The daily moving averages also confirm a bullish trend. Dow Theory supports this bullish stance on both weekly and monthly time frames. However, the monthly MACD and KST are mildly bearish, indicating some caution. Overall, the strength of the bullish trend is reinforced by significant returns over various periods compared to the Sensex, particularly a 67.84% return over the past year.

View full answer

How has been the historical performance of Pearl Global Ind?

14-Nov-2025

Pearl Global Ind has shown significant growth in net sales and profitability, with net sales increasing from 1,490.93 Cr in March 2021 to 4,506.29 Cr in March 2025, and profit after tax rising from 17.48 Cr to 230.77 Cr in the same period, indicating a strong financial performance. Total assets and liabilities also grew correspondingly, reflecting controlled cost management and improved operating cash flow.

Answer:<BR>The historical performance of Pearl Global Ind shows significant growth in net sales and profitability over the years, culminating in the fiscal year ending March 2025.<BR><BR>Breakdown:<BR>Pearl Global Ind has demonstrated a robust increase in net sales, rising from 1,490.93 Cr in March 2021 to 4,506.29 Cr in March 2025. This upward trend is reflected in total operating income, which also grew from 1,685.13 Cr in March 2020 to 4,506.29 Cr in March 2025. The company's total expenditure, excluding depreciation, increased correspondingly from 1,430.37 Cr in March 2021 to 4,102.67 Cr in March 2025, indicating a controlled growth in costs relative to sales. Operating profit (PBDIT) has improved significantly, reaching 437.17 Cr in March 2025 from just 84.06 Cr in March 2021, while profit before tax rose to 267.33 Cr in March 2025 from 11.36 Cr in March 2021. Consequently, profit after tax surged to 230.77 Cr in March 2025, up from 17.48 Cr in March 2021. The company's total assets increased from 1,251.43 Cr in March 2020 to 2,589.20 Cr in March 2025, while total liabilities also rose from 1,251.43 Cr to 2,589.20 Cr in the same period. Cash flow from operating activities showed a positive trend, reaching 176 Cr in March 2025, despite fluctuations in cash flow from investing and financing activities. Overall, Pearl Global Ind's financial metrics indicate a strong growth trajectory and improved profitability over the years.

View full answer

Has Pearl Global Ind declared dividend?

13-Nov-2025

Yes, Pearl Global Industries Ltd has declared a dividend of 120% (₹5 per share), with an ex-date of November 17, 2025. The company has demonstrated strong performance, achieving total returns of up to 2000.89% over the past five years.

Pearl Global Industries Ltd has declared a dividend.<BR><BR>Dividend Details:<BR>- Percentage announced: 120%<BR>- Amount per share: 5<BR>- Ex-date: 17 Nov 25<BR><BR>Dividend Yield: 0.29%.<BR><BR>Total Returns by Period:<BR>In the last 3 months, the price return was 33.81%, the dividend return was 0.45%, resulting in a total return of 34.26%.<BR><BR>Over the past 6 months, the price return reached 51.36%, with a dividend return of 0.51%, leading to a total return of 51.87%.<BR><BR>In the 1-year period, the price return was 71.53%, the dividend return was 1.07%, culminating in a total return of 72.6%.<BR><BR>For the 2-year period, the price return was 164.99%, the dividend return was 1.79%, resulting in a total return of 166.78%.<BR><BR>In the last 3 years, the price return was 693.34%, with a dividend return of 14.95%, leading to a total return of 708.29%.<BR><BR>Over the 4-year period, the price return was 1043.23%, the dividend return was 22.26%, resulting in a total return of 1065.49%.<BR><BR>In the 5-year period, the price return was 1954.73%, with a dividend return of 46.16%, culminating in a total return of 2000.89%.<BR><BR>Overall, Pearl Global Industries Ltd has shown a strong performance with significant total returns over various periods, alongside a notable dividend declaration, indicating a positive outlook for investors.

View full answer

Who are the top shareholders of the Pearl Global Ind?

06-Jun-2025

The top shareholders of Pearl Global Industries include promoter Pulkit Seth with 30.25%, mutual funds with 11.03%, foreign institutional investors at 7.39%, and individual investors holding 14.27%. The largest public shareholder is HDFC Small Cap Fund, owning 6.11%.

The top shareholders of Pearl Global Industries include the promoters, who hold the majority of the shares. The promoter with the highest holding is Pulkit Seth, owning 30.25% of the company. Additionally, mutual funds collectively hold 11.03% through 11 different schemes, while foreign institutional investors (FIIs) own 7.39% through 97 different entities. The highest public shareholder is HDFC Small Cap Fund, which holds 6.11%. Individual investors also have a significant stake, accounting for 14.27% of the total shares.

View full answer

When is the next results date for Pearl Global Ind?

06-Jun-2025

No Upcoming Board Meetings

iScoreScore
Click here to find our call on this stock
Strong Sell
Sell
Hold
Buy
Strong Buy

Dashboard

1

High Management Efficiency with a high ROCE of 20.00%

 
2

Strong ability to service debt as the company has a low Debt to EBITDA ratio of 2.03 times

 
3

Healthy long term growth as Net Sales has grown by an annual rate of 24.62% and Operating profit at 56.48%

 
4

Positive results in Jun 26

5

High Institutional Holdings at 25.98%

6

Consistent Returns over the last 3 years

stock-summaryMojo Parameters

Mojo Parameters

Loading Valuation Snapshot...

Stock DNA

stock-summary
Industry

Garments & Apparels

stock-summary
Market cap

INR 10,598 Cr (Small Cap)

stock-summary
P/E

34.00

stock-summary
Industry P/E

28

stock-summary
Dividend Yield

0.63%

stock-summary
Debt Equity

0.13

stock-summary
Return on Equity

19.09%

stock-summary
Price to Book

7.30

Revenue and Profits:
Net Sales:
1,528 Cr
(Quarterly Results - Jun 2026)
Net Profit:
101 Cr
stock-summaryTotal Returns
Total Returns (Price + Dividend) stock-summary
Dividend Yield (0.63%)
TimePeriod
Price Return
Dividend Return
Total Return
3 Months
41.43%
0%
41.43%
6 Months
49.1%
0.57%
49.67%
1 Year
79.54%
1.17%
80.71%
2 Years
110.8%
2.05%
112.85%
3 Years
572.55%
5.54%
578.09%
4 Years
700.2%
12.70%
712.9%
5 Years
1400.59%
22.86%
1423.45%

Latest dividend: 8.5 per share ex-dividend date: May-21-2026

Risk Adjusted Returns v/s stock-summary
Returns Beta
Icon
Beta has not been calculated since enough price history is not available
stock-summaryNews & Corporate Actions

Announcements stock-summary

Pearl Global Industries Limited - Investor Presentation

26-Nov-2019 | Source : NSE

Pearl Global Industries Limited has informed the Exchange regarding Investor Presentation

Pearl Global Industries Limited - Updates

09-Oct-2019 | Source : NSE

Pearl Global Industries Limited has informed the Exchange regarding 'Certificate under Regulation 74(5) of SEBI (Depositories and Participants) Regulations, 2018 for the quarter ended September 30, 2019 '.

Pearl Global Industries Limited - Shareholders meeting

26-Sep-2019 | Source : NSE

Pearl Global Industries Limited has submitted the Exchange a copy Srutinizers report of Annual General Meeting held on September 24, 2019

Corporate Actions stock-summary

stock-summary
BOARD MEETING

No Upcoming Board Meetings

stock-summary
DIVIDEND

Pearl Global Industries Ltd has declared 170% dividend, ex-date: 21 May 26

stock-summary
SPLITS

Pearl Global Industries Ltd has announced 5:10 stock split, ex-date: 05 Jan 24

stock-summary
BONUS

No Bonus history available

stock-summary
RIGHTS

No Rights history available

stock-summaryKey Factors

Quality key factors stock-summary

Factor
Value
Sales Growth (5y)
24.62%
EBIT Growth (5y)
56.48%
EBIT to Interest (avg)
3.26
Debt to EBITDA (avg)
2.58
Net Debt to Equity (avg)
0.13
Sales to Capital Employed (avg)
2.35
Tax Ratio
13.85%
Dividend Payout Ratio
21.27%
Pledged Shares
0
Institutional Holding
25.98%
ROCE (avg)
19.87%
ROE (avg)
18.15%

Valuation key factors

Factor
Value
P/E Ratio
34
Industry P/E
28
Price to Book Value
7.30
EV to EBIT
25.73
EV to EBITDA
21.07
EV to Capital Employed
6.56
EV to Sales
2.04
PEG Ratio
1.44
Dividend Yield
0.63%
ROCE (Latest)
22.75%
ROE (Latest)
19.09%

Technicals key factors

Indicator
Weekly
Monthly
MACD
Bullish
Bullish
RSI
No Signal
No Signal
Bollinger Bands
Mildly Bullish
Bullish
Moving Averages
Bullish (Daily)
KST
Bullish
Mildly Bearish
Dow Theory
Mildly Bearish
Bullish
OBV
Bullish
Bullish
stock-summary Technical Indicator Scale: Bearish, Mildly Bearish, Sideways, Mildly Bullish, Bullish  Turned 
stock-summaryShareholding
Shareholding Snapshot : Jun 2026stock-summary
Shareholding Compare (%holding) stock-summary
Majority shareholders

Promoters

Pledged Promoter Holdings

None

Mutual Funds

Held by 12 Schemes (18.67%)

FIIs

Held by 96 FIIs (6.82%)

Promoter with highest holding

Pulkit Seth (30.09%)

Highest Public shareholder

Hdfc Small Cap Fund (8.32%)

Individual Investors Holdings

9.59%

stock-summaryFinancial
[
  {
    "link": "quarterly",
    "btn_text": "All Quarterly Results",
    "header": "Quarterly Results Snapshot (Consolidated) - Jun'26 - YoY",
    "rhs": [
      {
        "prefix": "Net Sales ",
        "suffix": "YoY Growth in quarter ended Jun 2026 is 24.46% vs 16.63% in Jun 2025",
        "dir": 1
      },
      {
        "prefix": "Consolidated Net Profit ",
        "suffix": "YoY Growth in quarter ended Jun 2026 is 48.20% vs 3.78% in Jun 2025",
        "dir": 1
      }
    ],
    "table": {
      "header": [
        "Jun'26",
        "Jun'25",
        "Change(%)"
      ],
      "body": [
        {
          "field": "Net Sales",
          "val1": "1,528.26",
          "val2": "1,227.92",
          "chgp": "24.46%",
          "chgp_class": "positive"
        },
        {
          "field": "Operating Profit (PBDIT) excl Other Income",
          "val1": "163.83",
          "val2": "112.42",
          "chgp": "45.73%",
          "chgp_class": "positive"
        },
        {
          "field": "Interest",
          "val1": "26.58",
          "val2": "27.35",
          "chgp": "-2.82%",
          "chgp_class": "positive"
        },
        {
          "field": "Exceptional Items",
          "val1": "-2.73",
          "val2": "-0.32",
          "chgp": "-753.12%",
          "chgp_class": "negative"
        },
        {
          "field": "Consolidate Net Profit",
          "val1": "100.51",
          "val2": "67.82",
          "chgp": "48.20%",
          "chgp_class": "positive"
        },
        {
          "field": "Operating Profit Margin (Excl OI)",
          "val1": "10.72%",
          "val2": "9.16%",
          "chgp": "1.56%",
          "chgp_class": "positive"
        }
      ]
    }
  },
  {
    "link": "half-yearly",
    "btn_text": "All Half Yearly Results",
    "header": "Half Yearly Results Snapshot (Consolidated) - Sep'25",
    "rhs": [
      {
        "prefix": "Net Sales ",
        "suffix": " Growth in half year ended Sep 2025 is 12.69% vs 21.56% in Sep 2024",
        "dir": -1
      },
      {
        "prefix": "Consolidated Net Profit ",
        "suffix": " Growth in half year ended Sep 2025 is 13.99% vs 41.12% in Sep 2024",
        "dir": -1
      }
    ],
    "table": {
      "header": [
        "Sep'25",
        "Sep'24",
        "Change(%)"
      ],
      "body": [
        {
          "field": "Net Sales",
          "val1": "2,540.85",
          "val2": "2,254.72",
          "chgp": "12.69%",
          "chgp_class": "positive"
        },
        {
          "field": "Operating Profit (PBDIT) excl Other Income",
          "val1": "233.44",
          "val2": "195.03",
          "chgp": "19.69%",
          "chgp_class": "positive"
        },
        {
          "field": "Interest",
          "val1": "54.78",
          "val2": "47.73",
          "chgp": "14.77%",
          "chgp_class": "negative"
        },
        {
          "field": "Exceptional Items",
          "val1": "-0.30",
          "val2": "1.40",
          "chgp": "-121.43%",
          "chgp_class": "negative"
        },
        {
          "field": "Consolidate Net Profit",
          "val1": "141.14",
          "val2": "123.82",
          "chgp": "13.99%",
          "chgp_class": "positive"
        },
        {
          "field": "Operating Profit Margin (Excl OI)",
          "val1": "9.19%",
          "val2": "8.65%",
          "chgp": "0.54%",
          "chgp_class": "positive"
        }
      ]
    }
  },
  {
    "link": "nine-monthly",
    "btn_text": "All Nine Monthly Results",
    "header": "Nine Monthly Results Snapshot (Consolidated) - Dec'25",
    "rhs": [
      {
        "prefix": "Net Sales ",
        "suffix": "YoY Growth in nine months ended Dec 2025 is 13.24% vs 28.08% in Dec 2024",
        "dir": -1
      },
      {
        "prefix": "Consolidated Net Profit ",
        "suffix": "YoY Growth in nine months ended Dec 2025 is 7.95% vs 45.83% in Dec 2024",
        "dir": -1
      }
    ],
    "table": {
      "header": [
        "Dec'25",
        "Dec'24",
        "Change(%)"
      ],
      "body": [
        {
          "field": "Net Sales",
          "val1": "3,711.03",
          "val2": "3,277.25",
          "chgp": "13.24%",
          "chgp_class": "positive"
        },
        {
          "field": "Operating Profit (PBDIT) excl Other Income",
          "val1": "329.39",
          "val2": "286.37",
          "chgp": "15.02%",
          "chgp_class": "positive"
        },
        {
          "field": "Interest",
          "val1": "76.92",
          "val2": "71.92",
          "chgp": "6.95%",
          "chgp_class": "negative"
        },
        {
          "field": "Exceptional Items",
          "val1": "-0.70",
          "val2": "1.40",
          "chgp": "-150.00%",
          "chgp_class": "negative"
        },
        {
          "field": "Consolidate Net Profit",
          "val1": "194.40",
          "val2": "180.09",
          "chgp": "7.95%",
          "chgp_class": "positive"
        },
        {
          "field": "Operating Profit Margin (Excl OI)",
          "val1": "8.88%",
          "val2": "8.74%",
          "chgp": "0.14%",
          "chgp_class": "positive"
        }
      ]
    }
  },
  {
    "link": "annual",
    "btn_text": "All Annual Results",
    "header": "Annual Results Snapshot (Consolidated) - Mar'26",
    "rhs": [
      {
        "prefix": "Net Sales ",
        "suffix": "YoY Growth in year ended Mar 2026 is 11.50% vs 31.14% in Mar 2025",
        "dir": -1
      },
      {
        "prefix": "Consolidated Net Profit ",
        "suffix": "YoY Growth in year ended Mar 2026 is 11.81% vs 42.04% in Mar 2025",
        "dir": -1
      }
    ],
    "table": {
      "header": [
        "Mar'26",
        "Mar'25",
        "Change(%)"
      ],
      "body": [
        {
          "field": "Net Sales",
          "val1": "5,024.60",
          "val2": "4,506.29",
          "chgp": "11.50%",
          "chgp_class": "positive"
        },
        {
          "field": "Operating Profit (PBDIT) excl Other Income",
          "val1": "463.90",
          "val2": "403.62",
          "chgp": "14.93%",
          "chgp_class": "positive"
        },
        {
          "field": "Interest",
          "val1": "103.22",
          "val2": "99.19",
          "chgp": "4.06%",
          "chgp_class": "negative"
        },
        {
          "field": "Exceptional Items",
          "val1": "-1.23",
          "val2": "4.56",
          "chgp": "-126.97%",
          "chgp_class": "negative"
        },
        {
          "field": "Consolidate Net Profit",
          "val1": "277.65",
          "val2": "248.33",
          "chgp": "11.81%",
          "chgp_class": "positive"
        },
        {
          "field": "Operating Profit Margin (Excl OI)",
          "val1": "9.23%",
          "val2": "8.96%",
          "chgp": "0.27%",
          "chgp_class": "positive"
        }
      ]
    }
  }
]

Quarterly Results Snapshot (Consolidated) - Jun'26 - YoYstock-summary

Jun'26
Jun'25
Change(%)
Net Sales
1,528.26
1,227.92
24.46%
Operating Profit (PBDIT) excl Other Income
163.83
112.42
45.73%
Interest
26.58
27.35
-2.82%
Exceptional Items
-2.73
-0.32
-753.12%
Consolidate Net Profit
100.51
67.82
48.20%
Operating Profit Margin (Excl OI)
10.72%
9.16%
1.56%
Values in Rs Cr.
Direction Arrows
Net Sales

YoY Growth in quarter ended Jun 2026 is 24.46% vs 16.63% in Jun 2025

Direction Arrows
Consolidated Net Profit

YoY Growth in quarter ended Jun 2026 is 48.20% vs 3.78% in Jun 2025

Half Yearly Results Snapshot (Consolidated) - Sep'25stock-summary

Sep'25
Sep'24
Change(%)
Net Sales
2,540.85
2,254.72
12.69%
Operating Profit (PBDIT) excl Other Income
233.44
195.03
19.69%
Interest
54.78
47.73
14.77%
Exceptional Items
-0.30
1.40
-121.43%
Consolidate Net Profit
141.14
123.82
13.99%
Operating Profit Margin (Excl OI)
9.19%
8.65%
0.54%
Values in Rs Cr.
Direction Arrows
Net Sales

Growth in half year ended Sep 2025 is 12.69% vs 21.56% in Sep 2024

Direction Arrows
Consolidated Net Profit

Growth in half year ended Sep 2025 is 13.99% vs 41.12% in Sep 2024

Nine Monthly Results Snapshot (Consolidated) - Dec'25stock-summary

Dec'25
Dec'24
Change(%)
Net Sales
3,711.03
3,277.25
13.24%
Operating Profit (PBDIT) excl Other Income
329.39
286.37
15.02%
Interest
76.92
71.92
6.95%
Exceptional Items
-0.70
1.40
-150.00%
Consolidate Net Profit
194.40
180.09
7.95%
Operating Profit Margin (Excl OI)
8.88%
8.74%
0.14%
Values in Rs Cr.
Direction Arrows
Net Sales

YoY Growth in nine months ended Dec 2025 is 13.24% vs 28.08% in Dec 2024

Direction Arrows
Consolidated Net Profit

YoY Growth in nine months ended Dec 2025 is 7.95% vs 45.83% in Dec 2024

Annual Results Snapshot (Consolidated) - Mar'26stock-summary

Mar'26
Mar'25
Change(%)
Net Sales
5,024.60
4,506.29
11.50%
Operating Profit (PBDIT) excl Other Income
463.90
403.62
14.93%
Interest
103.22
99.19
4.06%
Exceptional Items
-1.23
4.56
-126.97%
Consolidate Net Profit
277.65
248.33
11.81%
Operating Profit Margin (Excl OI)
9.23%
8.96%
0.27%
Values in Rs Cr.
Direction Arrows
Net Sales

YoY Growth in year ended Mar 2026 is 11.50% vs 31.14% in Mar 2025

Direction Arrows
Consolidated Net Profit

YoY Growth in year ended Mar 2026 is 11.81% vs 42.04% in Mar 2025

stock-summaryCompany CV
About Pearl Global Industries Ltd stock-summary
stock-summary
Pearl Global Industries Ltd
Small Cap
Garments & Apparels
Pearl Global Industries Limited was initially incorporated as 'Minia Estates Private Limited' on July 5, 1989. The name was changed from Minia Estates Private Limited to House of Pearl Fashions Private Limited on May 9, 2006. The status was converted to Public Company and the name of the Company was changed to 'House of Pearl Fashions Limited' and further to 'Pearl Global Industries Limited' on January 12, 2012.
Company Coordinates stock-summary
Company Details
A-3 Community Centre Phase II, Naraina Industrial Area New Delhi New Delhi : 110028
stock-summary
Tel:
stock-summary
investor.pgil@pearlglobal.com
Registrar Details
Link Intime India Pvt Ltd., Narang Tower 44, Community Centre, Naraina Industrial Area , Phase - 1, New Delhi