
Compare Pee Cee Cosma with Similar Stocks
Total Returns (Price + Dividend) 
Latest dividend: 2.959683794466403 per share ex-dividend date: Sep-19-2025
Risk Adjusted Returns v/s
Returns Beta

News

Pee Cee Cosma Sope Ltd Upgraded to Sell on Technical Improvements Despite Mixed Fundamentals
Pee Cee Cosma Sope Ltd, a micro-cap player in the FMCG sector, has seen its investment rating upgraded from Strong Sell to Sell as of 13 July 2026. This change reflects a nuanced shift in the company’s technical outlook amid persistent fundamental challenges. While the stock’s technical indicators have improved modestly, underlying financial trends and valuation metrics continue to weigh on investor sentiment.
Read full news article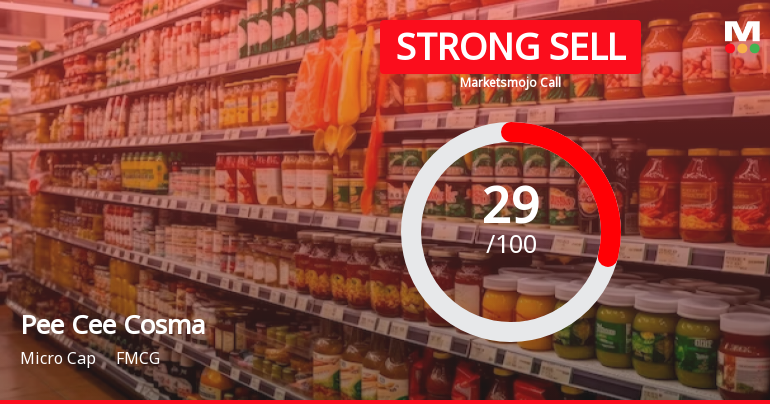
Pee Cee Cosma Sope Ltd is Rated Strong Sell
Pee Cee Cosma Sope Ltd is rated Strong Sell by MarketsMOJO, with this rating last updated on 09 February 2026. However, the analysis and financial metrics discussed below reflect the stock’s current position as of 09 July 2026, providing investors with an up-to-date view of the company’s fundamentals, valuation, financial trend, and technical outlook.
Read full news article
Pee Cee Cosma Sope Ltd is Rated Strong Sell
Pee Cee Cosma Sope Ltd is rated Strong Sell by MarketsMOJO, with this rating last updated on 09 Feb 2026. However, the analysis and financial metrics discussed here reflect the stock’s current position as of 28 June 2026, providing investors with an up-to-date view of the company’s fundamentals, valuation, financial trends, and technical outlook.
Read full news article Announcements
Compliances-Certificate under Reg. 74 (5) of SEBI (DP) Regulations 2018
01-Jul-2026 | Source : BSECERTIFICATE UNDER REG 74(5) OF SEBI (DP) REGULATIONS 2018 FOR THE QUARTER ENDED 30TH JUNE 2026
Compliances-Certificate under Reg. 74 (5) of SEBI (DP) Regulations 2018
01-Jul-2026 | Source : BSECERTIFICATE UNDER REG 74(5) OF SEBI (DP) REGULATIONS 2018 FOR THE QUARTER ENDED 30TH JUNE 2026
Closure of Trading Window
22-Jun-2026 | Source : BSECLOSURE OF TRADING WINDOW FROM 1ST JULY 2026 TILL COMPLETION OF 48 HOURS FROM THE ANNOUNCEMENT OF UNAUDITED FINANCIAL RESULTS FOR THE QUARTER ENDED 30TH JUNE 2026 TO STOCK EXCHANGE
Corporate Actions

No Upcoming Board Meetings

Pee Cee Cosma Sope Ltd has declared 30% dividend, ex-date: 19 Sep 25

No Splits history available

No Bonus history available

No Rights history available
Quality key factors
Valuation key factors
Technicals key factors
 Technical Indicator Scale: Bearish, Mildly Bearish, Sideways, Mildly Bullish, Bullish Turned
 Shareholding Snapshot : Mar 2026
Shareholding Compare (%holding)
Promoters
None
Held by 0 Schemes
Held by 0 FIIs
Ankit Jain (9.44%)
None
21.05%
Quarterly Results Snapshot (Consolidated) - Mar'26 - YoY

YoY Growth in quarter ended Mar 2026 is 19.81% vs 18.50% in Mar 2025
YoY Growth in quarter ended Mar 2026 is 48.44% vs -76.38% in Mar 2025
Half Yearly Results Snapshot (Standalone) - Sep'25
Growth in half year ended Sep 2025 is 2.34% vs 2.14% in Sep 2024

Growth in half year ended Sep 2025 is -25.96% vs 21.66% in Sep 2024
Nine Monthly Results Snapshot (Standalone) - Dec'25
YoY Growth in nine months ended Dec 2025 is 8.92% vs 1.93% in Dec 2024
YoY Growth in nine months ended Dec 2025 is -16.20% vs 15.78% in Dec 2024
Annual Results Snapshot (Consolidated) - Mar'26
YoY Growth in year ended Mar 2026 is 9.44% vs 8.01% in Mar 2025
YoY Growth in year ended Mar 2026 is -13.59% vs -7.66% in Mar 2025
About Pee Cee Cosma Sope Ltd

Company Coordinates


