
Compare Petronet LNG with Similar Stocks
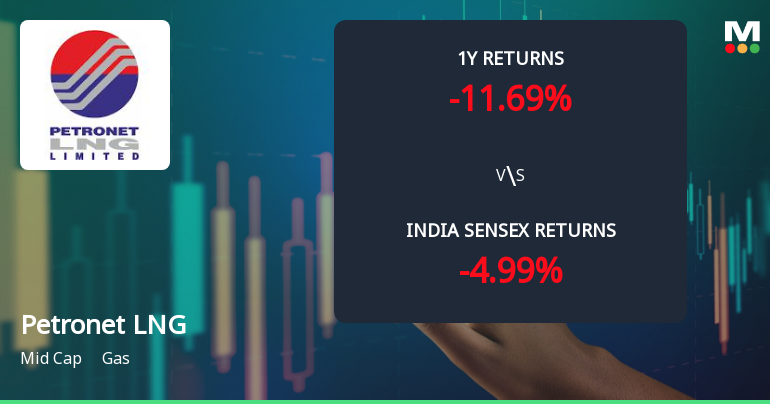
Total Returns (Price + Dividend) 
Latest dividend: 3.001092100473244 per share ex-dividend date: Jun-12-2026
Risk Adjusted Returns v/s
Returns Beta

News
Petronet LNG Ltd. Technical Momentum Shifts Amid Bearish Signals
Petronet LNG Ltd., a mid-cap player in the gas sector, has experienced a notable shift in its technical momentum, moving from a mildly bearish stance to a more pronounced bearish trend. Despite a recent upgrade in its Mojo Grade from Sell to Hold, the stock’s technical indicators reveal a complex picture of mixed signals, with key momentum oscillators and moving averages suggesting caution for investors.
Read full news article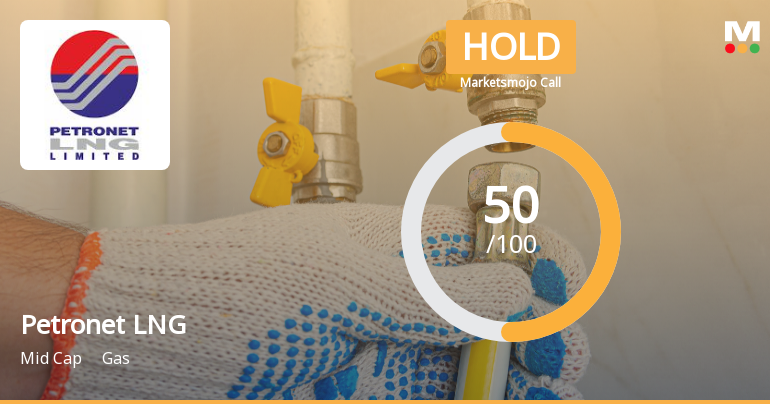
Petronet LNG Ltd. Upgraded to Hold by MarketsMOJO on Technical Improvements
Petronet LNG Ltd., a key player in the gas sector, has seen its investment rating upgraded from Sell to Hold, reflecting a nuanced improvement in its technical outlook alongside stable financial and valuation metrics. This shift comes amid a backdrop of flat quarterly results and a mixed performance relative to the broader market, signalling cautious optimism among analysts and investors alike.
Read full news article
Petronet LNG Ltd. Technical Momentum Shifts Amid Mixed Market Signals
Petronet LNG Ltd. has experienced a nuanced shift in its technical momentum, with key indicators signalling a transition from bearish to mildly bearish trends on the weekly timeframe, while monthly signals remain predominantly negative. This mixed technical landscape, combined with a recent upgrade in the company’s Mojo Grade to Sell from Hold, reflects evolving market sentiment amid fluctuating price action and sector dynamics.
Read full news article Announcements
Petronet LNG Limited - Other General Purpose
28-Nov-2019 | Source : NSEPetronet LNG Limited has informed the Exchange regarding Intimation pursuant to SEBI ( LODR) Regulations, 2015.
Petronet LNG Limited - Dividend
30-Oct-2019 | Source : NSEPetronet LNG Limited has informed the Exchange that Board of Directors at its meeting held on October 29, 2019, declared Special Interim Dividend of 5.50 per equity share along with Unaudited Financial Results along with Limited Review Report for the quarter/half year ended 30th September, 2019
Petronet LNG Limited - Analysts/Institutional Investor Meet/Con. Call Updates
25-Oct-2019 | Source : NSEPetronet LNG Limited has informed the Exchange regarding Analysts/Institutional Investor Meet/Con. Call Updates
Corporate Actions

No Upcoming Board Meetings

Petronet LNG Ltd. has declared 30% dividend, ex-date: 12 Jun 26

No Splits history available

Petronet LNG Ltd. has announced 1:1 bonus issue, ex-date: 03 Jul 17

No Rights history available
Quality key factors
Valuation key factors
Technicals key factors
 Technical Indicator Scale: Bearish, Mildly Bearish, Sideways, Mildly Bullish, Bullish Turned
 Shareholding Snapshot : Mar 2026
Shareholding Compare (%holding)
Promoters
None
Held by 32 Schemes (11.72%)
Held by 718 FIIs (27.12%)
Oil And Natural Gas Corporation Limited (12.5%)
Sbi Psu Fund (4.21%)
8.58%
Quarterly Results Snapshot (Consolidated) - Mar'26 - QoQ

QoQ Growth in quarter ended Mar 2026 is -15.42% vs 1.41% in Dec 2025

QoQ Growth in quarter ended Mar 2026 is 57.63% vs 4.73% in Dec 2025
Half Yearly Results Snapshot (Consolidated) - Sep'25
Growth in half year ended Sep 2025 is -13.43% vs 9.30% in Sep 2024
Growth in half year ended Sep 2025 is -15.38% vs 17.97% in Sep 2024
Nine Monthly Results Snapshot (Consolidated) - Dec'25
YoY Growth in nine months ended Dec 2025 is -11.93% vs -0.69% in Dec 2024
YoY Growth in nine months ended Dec 2025 is -11.68% vs -0.35% in Dec 2024
Annual Results Snapshot (Consolidated) - Mar'26
YoY Growth in year ended Mar 2026 is -14.69% vs -3.31% in Mar 2025
YoY Growth in year ended Mar 2026 is -1.51% vs 8.77% in Mar 2025
About Petronet LNG Ltd.

Company Coordinates


