
Compare Adani Total Gas with Similar Stocks
Total Returns (Price + Dividend) 
Adani Total Gas for the last several years.
Risk Adjusted Returns v/s
Returns Beta

News
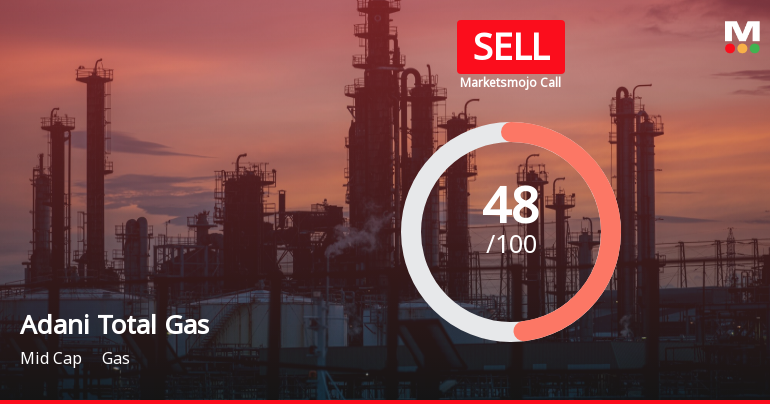
Adani Total Gas Ltd is Rated Sell
Adani Total Gas Ltd is rated 'Sell' by MarketsMOJO, a rating that was last updated on 27 Jan 2023. However, the analysis and financial metrics discussed here reflect the company’s current position as of 16 July 2026, providing investors with an up-to-date perspective on the stock’s fundamentals, valuation, financial trend, and technical outlook.
Read full news article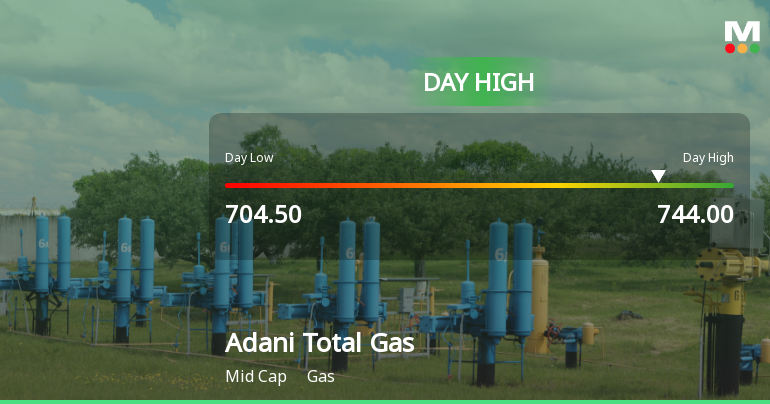
Adani Total Gas Ltd Surges 5.25% to Day's High of Rs 741.05 — Outperforms Sector by 3.88 Percentage Points
The Sensex advanced 1.04% on 10 Jul 2026, yet Adani Total Gas Ltd outpaced the broader market with a 5.25% gain, reaching an intraday high of Rs 741.05. This 3.88 percentage-point outperformance over its Gas sector peers highlights a distinctly stock-specific rally rather than a mere market tailwind.
Read full news article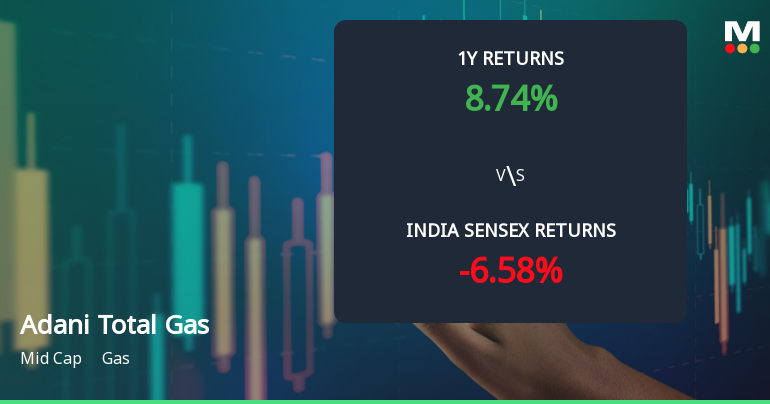
Adani Total Gas Ltd Technical Momentum Shifts Amid Mixed Market Signals
Adani Total Gas Ltd has experienced a nuanced shift in its technical momentum, moving from a bullish to a mildly bullish trend as of early July 2026. Despite a recent downgrade in its Mojo Grade from Buy to Sell, the stock’s technical indicators present a complex picture, with bullish signals on shorter timeframes contrasting with bearish momentum on longer-term measures. This article analyses the key technical parameters shaping investor sentiment and price action for this mid-cap gas sector player.
Read full news article Announcements
Adani Gas Limited - Reply to Clarification- Financial results
18-Nov-2019 | Source : NSEAdani Gas Limitedi Gas Limited for the quarter ended 30-Sep-2019 with respect to Regulation 33 of the SEBI (Listing Obligations and Disclosure Requirements) Regulations, 2015.
Adani Gas Limited - Clarification - Financial Results
14-Nov-2019 | Source : NSEAdani Gas Limitedmited for the quarter ended 30-Sep-2019 with respect to Regulation 33 of the SEBI (Listing Obligations and Disclosure Requirements) Regulations, 2015.
Adani Gas Limited - Public Announcement-Open Offer
22-Oct-2019 | Source : NSEAdani Gas Limited has submitted to the Exchange a copy of Detailed Public Statement in Terms of Regulations 3(1) and 4 Read with Regulations 13(4), 14(3), 15(2) and 15(3) of the Securities and Exchange Board of India ( Substantial Acquisition of Shares and Takeovers) Regulations , 2011, As Amended, to the Public Shareholders of Adani Gas Limited.
Corporate Actions

21 Jul 2026

Adani Total Gas Ltd has declared 25% dividend, ex-date: 12 Jun 26

No Splits history available

No Bonus history available

No Rights history available
Quality key factors
Valuation key factors
Technicals key factors
 Technical Indicator Scale: Bearish, Mildly Bearish, Sideways, Mildly Bullish, Bullish Turned
 Shareholding Snapshot : Jun 2026
Shareholding Compare (%holding)
Promoters
None
Held by 21 Schemes (0.2%)
Held by 135 FIIs (12.76%)
Totalenergies Holdings Sas (37.4%)
Life Insurance Corporation Of India (6.02%)
5.49%
Quarterly Results Snapshot (Consolidated) - Mar'26 - QoQ

QoQ Growth in quarter ended Mar 2026 is 3.31% vs 3.86% in Dec 2025

QoQ Growth in quarter ended Mar 2026 is 6.11% vs -2.96% in Dec 2025
Half Yearly Results Snapshot (Consolidated) - Sep'25
Growth in half year ended Sep 2025 is 19.70% vs 9.88% in Sep 2024
Growth in half year ended Sep 2025 is -8.03% vs 10.70% in Sep 2024
Nine Monthly Results Snapshot (Consolidated) - Dec'25
YoY Growth in nine months ended Dec 2025 is 18.55% vs 10.61% in Dec 2024
YoY Growth in nine months ended Dec 2025 is -2.49% vs 0.06% in Dec 2024
Annual Results Snapshot (Consolidated) - Mar'26
YoY Growth in year ended Mar 2026 is 17.89% vs 11.74% in Mar 2025
YoY Growth in year ended Mar 2026 is 0.20% vs -1.96% in Mar 2025
About Adani Total Gas Ltd

Company Coordinates


