
Compare Phaarmasia with Similar Stocks
Dashboard
With a Operating Losses, the company has a Weak Long Term Fundamental Strength
- Company's ability to service its debt is weak with a poor EBIT to Interest (avg) ratio of -1.16
Flat results in Mar 26
With ROE of 19.1, it has a Attractive valuation with a 6.6 Price to Book Value
Majority shareholders : Promoters
Market Beating performance in long term as well as near term
Stock DNA
Pharmaceuticals & Biotechnology
INR 75 Cr (Micro Cap)
35.00
34
0.00%
-0.04
19.11%
6.42
Total Returns (Price + Dividend) 
Phaarmasia for the last several years.
Risk Adjusted Returns v/s
Returns Beta

News

Phaarmasia Ltd Upgraded to Hold by MarketsMOJO Amid Mixed Financial Signals
Phaarmasia Ltd has seen its investment rating upgraded from Sell to Hold as of 8 June 2026, reflecting a nuanced shift in its overall outlook. This change is driven by a combination of factors including improved valuation metrics, stable quality indicators, mixed financial trends, and evolving technical signals. Despite recent flat quarterly performance and operational challenges, the stock’s long-term returns and relative valuation have prompted a reassessment of its market stance.
Read full news article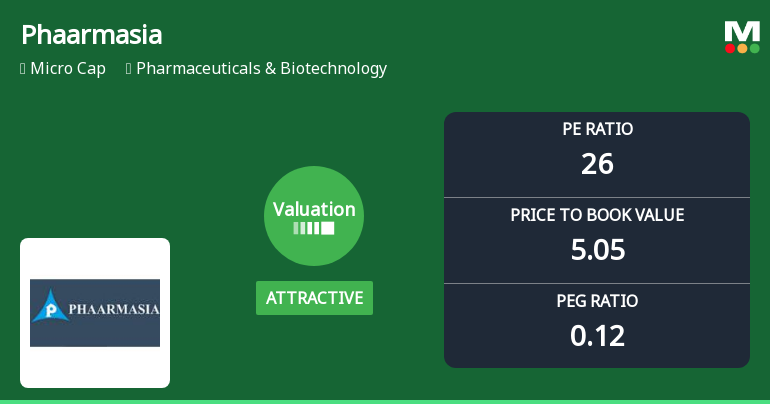
Phaarmasia Ltd Valuation Shifts Signal Renewed Price Attractiveness Amid Mixed Returns
Phaarmasia Ltd has witnessed a notable shift in its valuation parameters, moving from a very attractive to an attractive grade, reflecting evolving market perceptions amid a challenging pharmaceutical sector. Despite a recent downgrade in its Mojo Grade from Hold to Sell, the company’s valuation metrics suggest a more compelling price entry point relative to its historical averages and peer group, warranting a closer examination for investors seeking micro-cap opportunities in Pharmaceuticals & Biotechnology.
Read full news article
Phaarmasia Ltd Q4 FY26: Quarterly Loss Amid Revenue Volatility Raises Sustainability Concerns
Phaarmasia Limited (NSE: PHAARMASIA, BSE: 523620), a micro-cap pharmaceutical manufacturer specialising in hormonal contraceptive tablets, reported a troubling quarter-on-quarter deterioration in Q4 FY26, posting a net loss of ₹0.70 crores against a profit of ₹16.27 crores in the previous quarter. The Hyderabad-based company, with a modest market capitalisation of ₹53.00 crores, saw its net sales plummet 51.84% sequentially to ₹7.73 crores, raising serious questions about revenue sustainability and operational stability.
Read full news article Announcements
Announcement under Regulation 30 (LODR)-Newspaper Publication
01-Jun-2026 | Source : BSENewspaper Advertisement of the Audited Financial Results for the Quarter and year ended 31st March 2026
Board Meeting Outcome for Outcome Of The Board Meeting Held On Friday 29Th May 2026
29-May-2026 | Source : BSEPursuant to Regulation 30 read with Regulation 33 of SEBI (Listing Obligation and Disclosure Requirement) Regulations 2015 we would like to inform you that the meeting of Board of Directors of Phaarmasia Limited was held on Friday 29th day of May 2026 at 04:30 PM and concluded at 05:30 PM. Inter-alia the Board discussed and passed the following resolutions: 1. Approved the audited financial results of the Company for the quarter and year ended 31st March 2026. 2. Approved the Auditors report on the financial statements of the Company for the Financial year ended 31st March 2026. 3. Approved the appointment of Internal Auditors of the Company for the financial year 2026-27. 4. Approved the appointment of Secretarial Auditors of the Company for the financial year 2025-26.
Integrated Filing Of Financials For The Quarter And FY Ended 31St March 2026
29-May-2026 | Source : BSESubmission of Integrated Filing of Financials for the Quarter and FY ended 31st March 2026
Corporate Actions

No Upcoming Board Meetings

No Dividend history available

No Splits history available

No Bonus history available

No Rights history available
Quality key factors
Valuation key factors
Technicals key factors
 Technical Indicator Scale: Bearish, Mildly Bearish, Sideways, Mildly Bullish, Bullish Turned
 Shareholding Snapshot : Mar 2026
Shareholding Compare (%holding)
Promoters
None
Held by 0 Schemes
Held by 0 FIIs
Maneesh Pharmaceuticals Limited (44.22%)
Shubhada Godambe Atul (1.73%)
25.66%
Quarterly Results Snapshot (Standalone) - Mar'26 - QoQ

QoQ Growth in quarter ended Mar 2026 is -51.84% vs -3.02% in Dec 2025
QoQ Growth in quarter ended Mar 2026 is -104.30% vs 835.06% in Dec 2025
Half Yearly Results Snapshot (Standalone) - Sep'25

Growth in half year ended Sep 2025 is 64.70% vs -8.38% in Sep 2024
Growth in half year ended Sep 2025 is 643.24% vs 13.95% in Sep 2024
Nine Monthly Results Snapshot (Standalone) - Dec'25
YoY Growth in nine months ended Dec 2025 is 108.39% vs -8.06% in Dec 2024
YoY Growth in nine months ended Dec 2025 is 1,808.41% vs -8.08% in Dec 2024
Annual Results Snapshot (Standalone) - Mar'26
YoY Growth in year ended Mar 2026 is 93.72% vs -20.33% in Mar 2025
YoY Growth in year ended Mar 2026 is 1,205.03% vs -205.77% in Mar 2025
About Phaarmasia Ltd

Company Coordinates


