
Compare Plastiblends (I) with Similar Stocks
Stock DNA
Specialty Chemicals
INR 442 Cr (Micro Cap)
12.00
35
1.48%
-0.05
8.17%
0.98
Total Returns (Price + Dividend) 
Latest dividend: 2.5 per share ex-dividend date: Jul-08-2025
Risk Adjusted Returns v/s
Returns Beta

News

Plastiblends India Ltd Downgraded to Sell Amid Mixed Financial and Technical Signals
Plastiblends India Ltd, a micro-cap player in the specialty chemicals sector, has seen its investment rating downgraded from Hold to Sell as of 8 June 2026. This shift reflects a complex interplay of factors including deteriorating technical indicators, improved valuation metrics, mixed financial trends, and an overall reassessment of the company’s quality profile.
Read full news article
Plastiblends India Ltd Upgraded to Hold as Financials Improve Amid Valuation Concerns
Plastiblends India Ltd has seen its investment rating upgraded from Sell to Hold following a marked improvement in its quarterly financial performance, valuation metrics, and technical outlook. The specialty chemicals company’s recent results and underlying fundamentals have prompted a reassessment of its prospects, although challenges remain in its long-term growth trajectory.
Read full news article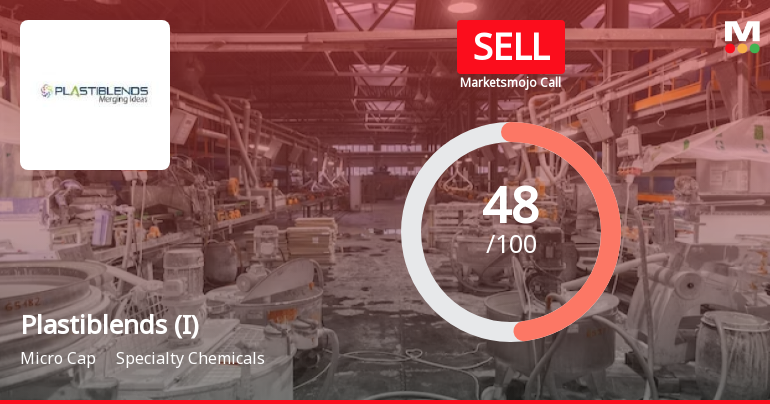
Plastiblends India Ltd is Rated Sell
Plastiblends India Ltd is rated 'Sell' by MarketsMOJO, with this rating last updated on 19 May 2026. However, the analysis and financial metrics discussed here reflect the stock's current position as of 31 May 2026, providing investors with an up-to-date view of the company’s fundamentals, returns, and market standing.
Read full news article Announcements
Announcement under Regulation 30 (LODR)-Newspaper Publication
03-Jun-2026 | Source : BSECopy of Newspaper publication regarding Transfer of Unclaimed Dividend and relevant equity shares to Investor Education and Protection Fund Authority.
Announcement under Regulation 30 (LODR)-Change in Management
27-Apr-2026 | Source : BSEOutcome of Board Meeting-Board approved re-appointment of Director retiring by rotation and Vice-Chairman & Managing Director subject to approval of shareholders in ensuing AGM.
Audited Financial Results For Quarter And Financial Year Ended 31St March 2026
27-Apr-2026 | Source : BSEAudited Financial Results for the Quarter and Financial Year ended 31st March 2026
Corporate Actions

No Upcoming Board Meetings

Plastiblends India Ltd has declared 50% dividend, ex-date: 08 Jul 25

Plastiblends India Ltd has announced 5:10 stock split, ex-date: 29 Feb 12

Plastiblends India Ltd has announced 1:1 bonus issue, ex-date: 03 Jul 17

No Rights history available
Quality key factors
Valuation key factors
Technicals key factors
 Technical Indicator Scale: Bearish, Mildly Bearish, Sideways, Mildly Bullish, Bullish Turned
 Shareholding Snapshot : Mar 2026
Shareholding Compare (%holding)
Promoters
None
Held by 0 Schemes
Held by 5 FIIs (0.24%)
Varun Satyanarayan Kabra (28.85%)
Minaxi Bhalchandra Trivedi (1.43%)
29.22%
Quarterly Results Snapshot (Standalone) - Mar'26 - QoQ

QoQ Growth in quarter ended Mar 2026 is 13.36% vs -3.54% in Dec 2025
QoQ Growth in quarter ended Mar 2026 is 114.22% vs -13.04% in Dec 2025
Half Yearly Results Snapshot (Standalone) - Sep'25
Growth in half year ended Sep 2025 is -1.18% vs -2.27% in Sep 2024

Growth in half year ended Sep 2025 is -4.66% vs -0.12% in Sep 2024
Nine Monthly Results Snapshot (Standalone) - Dec'25
YoY Growth in nine months ended Dec 2025 is -0.56% vs -3.64% in Dec 2024
YoY Growth in nine months ended Dec 2025 is -4.36% vs 0.34% in Dec 2024
Annual Results Snapshot (Standalone) - Mar'26
YoY Growth in year ended Mar 2026 is 1.05% vs -2.71% in Mar 2025
YoY Growth in year ended Mar 2026 is 9.72% vs -3.16% in Mar 2025
About Plastiblends India Ltd

Company Coordinates


