
Compare Platinum Industr with Similar Stocks
Stock DNA
Specialty Chemicals
INR 1,248 Cr (Micro Cap)
24.00
43
0.00%
-0.30
11.81%
2.82
Total Returns (Price + Dividend) 
Platinum Industr for the last several years.
Risk Adjusted Returns v/s
Returns Beta

News
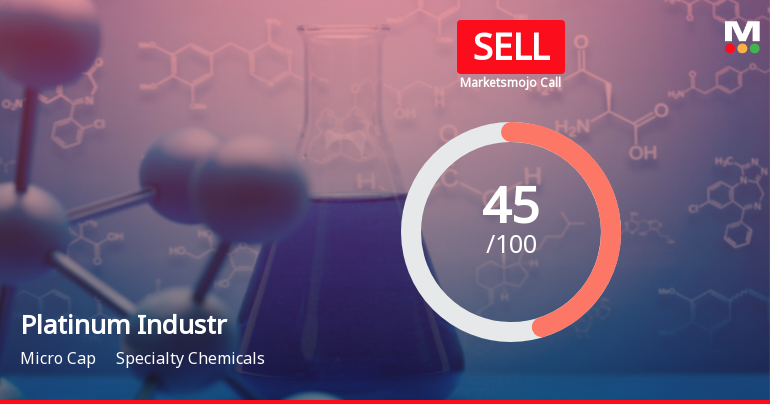
Platinum Industries Ltd Downgraded to Sell Amid Technical Weakness and Long-Term Growth Concerns
Platinum Industries Ltd, a micro-cap player in the Specialty Chemicals sector, has seen its investment rating downgraded from Hold to Sell as of 23 June 2026. The revision reflects a combination of deteriorating technical indicators, subdued long-term financial growth, and valuation concerns despite recent quarterly earnings strength and a net-debt free balance sheet.
Read full news article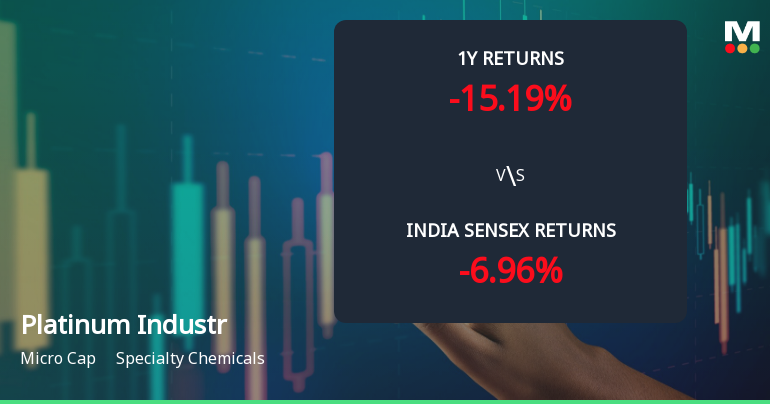
Platinum Industries Ltd Faces Technical Momentum Shift Amid Bearish Signals
Platinum Industries Ltd, a micro-cap player in the Specialty Chemicals sector, has experienced a notable shift in its technical momentum, moving from a mildly bullish to a mildly bearish stance. This transition is underscored by mixed signals from key technical indicators such as MACD, RSI, Bollinger Bands, and moving averages, reflecting growing investor caution amid recent price volatility.
Read full news article
Platinum Industries Ltd Technical Momentum Shifts to Mildly Bullish Amid Hold Rating Upgrade
Platinum Industries Ltd, a micro-cap player in the Specialty Chemicals sector, has exhibited a notable shift in its technical momentum, moving from a sideways trend to a mildly bullish stance. This change is underscored by mixed signals from key technical indicators such as MACD, RSI, Bollinger Bands, and moving averages, reflecting a nuanced market sentiment as the stock attempts to regain ground amid broader sectoral and market dynamics.
Read full news article Announcements
Intimation Of Schedule Of Plant Visit By Investor/ Analyst On Thursday 25Th June 2026.
16-Jun-2026 | Source : BSEPursuant to Regulation 30 of SEBI (LODR) this is to inform you that the Company has organized a plant visit for Investor/Analyst on Thursday 25th June 2026.
Compliances-Reg.24(A)-Annual Secretarial Compliance
28-May-2026 | Source : BSEEnclosed herewith Annual Secretarial Compliance Report for the year ended 31st March 2026.
Announcement Under Reg 30 Of SEBI (LODR) For The Commencement Of Commercial Production
21-May-2026 | Source : BSEAnnouncement under Reg 30 of SEBI (LODR) for the Commencement of Commercial Production for the manufacturing facility located at Palghar.
Corporate Actions

No Upcoming Board Meetings

No Dividend history available

No Splits history available

No Bonus history available

No Rights history available
Quality key factors
Valuation key factors
Technicals key factors
 Technical Indicator Scale: Bearish, Mildly Bearish, Sideways, Mildly Bullish, Bullish Turned
 Shareholding Snapshot : Mar 2026
Shareholding Compare (%holding)
Promoters
None
Held by 0 Schemes
Held by 6 FIIs (0.59%)
Krishna Dushyant Rana (45.55%)
Baring Private Equity India Aif 2 (2.68%)
19.44%
Quarterly Results Snapshot (Consolidated) - Mar'26 - QoQ

QoQ Growth in quarter ended Mar 2026 is 26.12% vs 6.39% in Dec 2025
QoQ Growth in quarter ended Mar 2026 is 19.97% vs 8.46% in Dec 2025
Half Yearly Results Snapshot (Consolidated) - Sep'25

Growth in half year ended Sep 2025 is 5.67% vs 64.70% in Sep 2024
Growth in half year ended Sep 2025 is -23.51% vs 37.81% in Sep 2024
Nine Monthly Results Snapshot (Consolidated) - Dec'25
YoY Growth in nine months ended Dec 2025 is 7.67% vs 60.70% in Dec 2024
YoY Growth in nine months ended Dec 2025 is -15.08% vs 31.17% in Dec 2024
Annual Results Snapshot (Consolidated) - Mar'26
YoY Growth in year ended Mar 2026 is 14.83% vs 48.36% in Mar 2025
YoY Growth in year ended Mar 2026 is 5.82% vs 12.28% in Mar 2025
About Platinum Industries Ltd

Company Coordinates


