
Compare PNGS Gargi FJ with Similar Stocks
Dashboard
Flat results in Mar 26
- PBT LESS OI(Q) At Rs 6.12 cr has Fallen at -31.0% (vs previous 4Q average)
- PAT(Q) At Rs 5.14 cr has Fallen at -32.4% (vs previous 4Q average)
- NET SALES(Q) At Rs 29.59 cr has Fallen at -16.9% (vs previous 4Q average)
With ROE of 22.2, it has a Expensive valuation with a 6.3 Price to Book Value
Despite the size of the company, domestic mutual funds hold only 0% of the company
Stock DNA
Gems, Jewellery And Watches
INR 845 Cr (Micro Cap)
29.00
44
0.00%
-0.51
22.15%
5.99
Total Returns (Price + Dividend) 
PNGS Gargi FJ for the last several years.
Risk Adjusted Returns v/s
Returns Beta

News
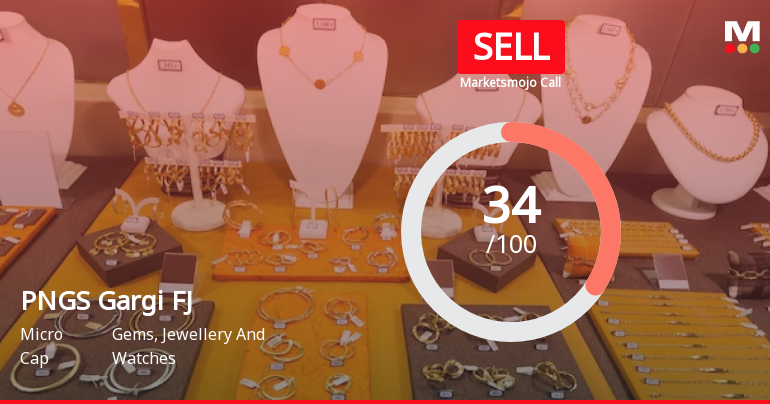
PNGS Gargi Fashion Jewellery Ltd is Rated Sell
PNGS Gargi Fashion Jewellery Ltd is rated 'Sell' by MarketsMOJO. This rating was last updated on 09 February 2026, reflecting a reassessment of the stock’s outlook. However, all fundamentals, returns, and financial metrics discussed here are current as of 11 June 2026, providing investors with the latest perspective on the company’s position.
Read full news article
PNGS Gargi Fashion Jewellery Ltd Faces Bearish Momentum Amid Technical Downgrade
PNGS Gargi Fashion Jewellery Ltd has experienced a notable shift in its technical momentum, with key indicators signalling a bearish trend. The company’s shares have declined sharply in recent weeks, reflecting deteriorating market sentiment amid broader sector challenges and a downgrade in its technical rating.
Read full news article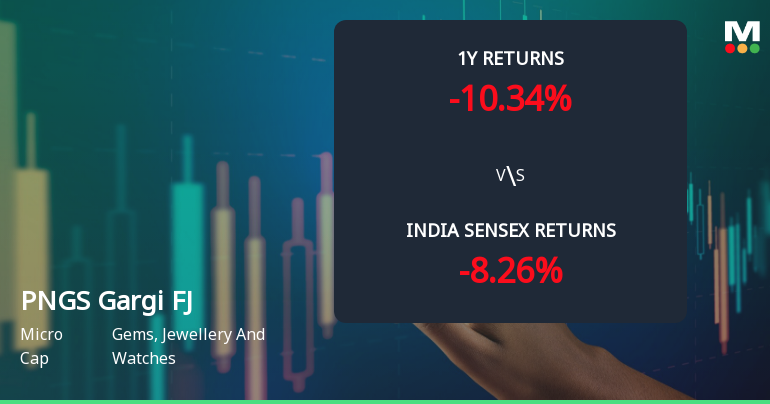
PNGS Gargi Fashion Jewellery Ltd Faces Bearish Momentum Amid Technical Deterioration
PNGS Gargi Fashion Jewellery Ltd has experienced a notable shift in price momentum, with technical indicators signalling a bearish outlook. The company’s shares have declined by 3.48% today, reflecting a broader deterioration in trend strength and investor sentiment within the Gems, Jewellery And Watches sector.
Read full news article Announcements
Announcement under Regulation 30 (LODR)-Analyst / Investor Meet - Intimation
08-Jun-2026 | Source : BSEThe company has scheduled an Investor Meet with identified investors and/ or analysts on Thursday June 11 2026.
Announcement under Regulation 30 (LODR)-Newspaper Publication
06-Jun-2026 | Source : BSEEnclosed copies of Newspaper Advertisement Titled Notice of Annual General Meeting published on June 06 2026.
Reg. 34 (1) Annual Report.
05-Jun-2026 | Source : BSEIn terms of regulation 34(1) of the SEBI (LODR) Regulations 2015 Annual Report of the Company for the FY 2025-26 is attached herewith.
Corporate Actions

No Upcoming Board Meetings

No Dividend history available

No Splits history available

No Bonus history available

No Rights history available
Quality key factors
Valuation key factors
Technicals key factors
 Technical Indicator Scale: Bearish, Mildly Bearish, Sideways, Mildly Bullish, Bullish Turned
 Shareholding Snapshot : Mar 2026
Shareholding Compare (%holding)
Promoters
None
Held by 0 Schemes
Held by 1 FIIs (0.02%)
Renu Govind Gadgil (31.74%)
Rajesh Pandey (1.82%)
27.6%
Quarterly Results Snapshot (Standalone) - Mar'26 - QoQ

QoQ Growth in quarter ended Mar 2026 is -35.76% vs -0.84% in Dec 2025
QoQ Growth in quarter ended Mar 2026 is -51.51% vs 3.21% in Dec 2025
Half Yearly Results Snapshot (Standalone) - Mar'26
Growth in half year ended Mar 2026 is 2.55% vs 25.14% in Sep 2025
Growth in half year ended Mar 2026 is 0.96% vs 17.57% in Sep 2025
Nine Monthly Results Snapshot (Standalone) - Dec'25
YoY Growth in nine months ended Dec 2025 is 15.60% vs 195.30% in Dec 2024
YoY Growth in nine months ended Dec 2025 is 6.03% vs 304.26% in Dec 2024
Annual Results Snapshot (Standalone) - Mar'26
YoY Growth in year ended Mar 2026 is 18.24% vs 150.15% in Mar 2025
YoY Growth in year ended Mar 2026 is 8.75% vs 240.54% in Mar 2025
About PNGS Gargi Fashion Jewellery Ltd

Company Coordinates


