
Compare PNGS Reva Diamo. with Similar Stocks
Stock DNA
Gems, Jewellery And Watches
INR 1,306 Cr (Small Cap)
21.00
47
0.00%
-0.30
12.55%
2.53
Total Returns (Price + Dividend) 

Risk Adjusted Returns v/s
Returns Beta
News
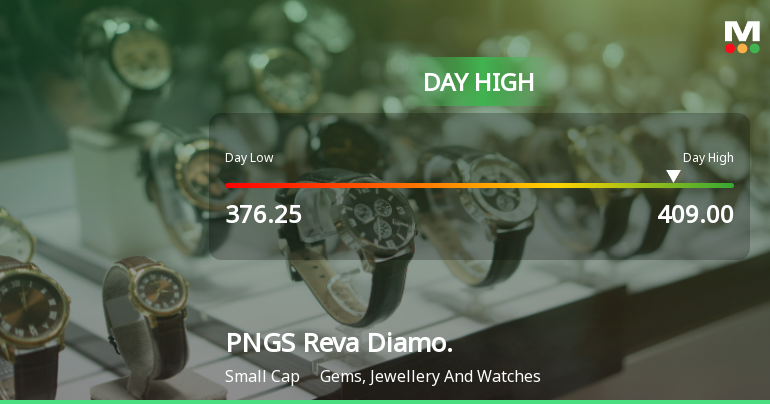
PNGS Reva Diamond Jewellery Limited Surges 7.09% to Day's High of Rs 409 — Outperforms Sector by 7.73 Percentage Points
The Sensex edged up 0.18% on 20 May 2026, while PNGS Reva Diamond Jewellery Limited surged 7.09%, touching an intraday high of Rs 409. This 7.73-percentage-point outperformance over its sector highlights a distinctly stock-specific rally rather than a broad market move.
Read full news article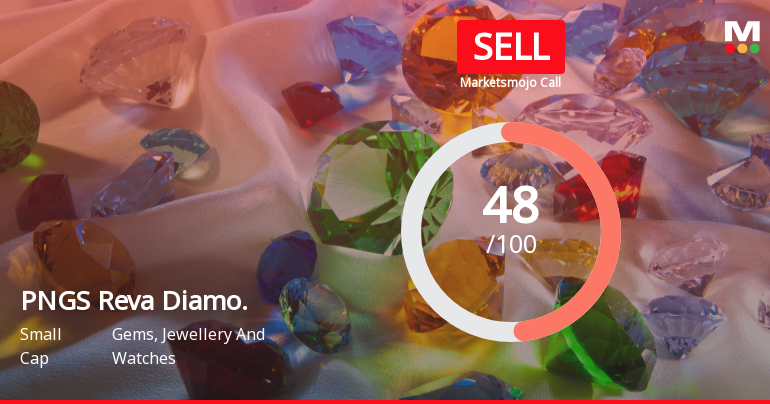
PNGS Reva Diamond Jewellery Downgraded to Sell Amid Mixed Fundamentals and Bearish Technicals
PNGS Reva Diamond Jewellery Limited has seen its investment rating downgraded from Hold to Sell, driven by a mixed bag of fundamental and technical factors. While valuation metrics have improved significantly, concerns over quality and technical trends have weighed heavily on the outlook, prompting a reassessment of the stock’s prospects in the competitive gems and jewellery sector.
Read full news article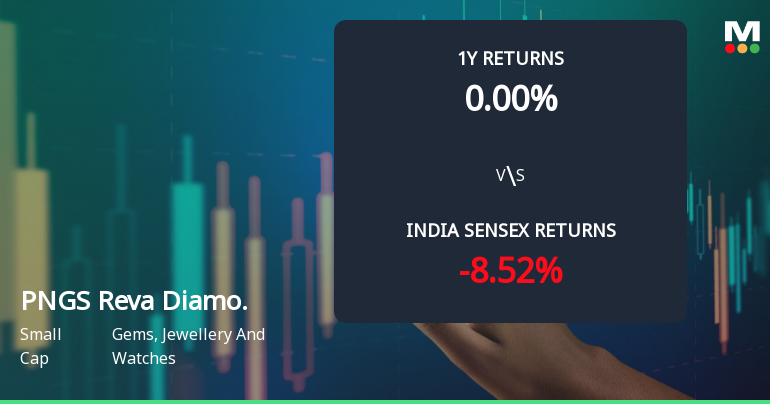
PNGS Reva Diamond Jewellery Limited Faces Technical Downshift Amid Price Momentum Weakness
PNGS Reva Diamond Jewellery Limited has experienced a notable shift in its technical momentum, moving from a mildly bullish stance to a mildly bearish outlook. This change is underscored by key technical indicators such as the MACD, RSI, and moving averages, signalling a cautious phase for investors amid a challenging market environment.
Read full news article Announcements
Announcement under Regulation 30 (LODR)-Analyst / Investor Meet - Intimation
19-May-2026 | Source : BSEThe company has scheduled an Investor/Analyst call with an identified investors and/or analysts on Friday May 22 2026.
Disclosures under Reg. 29(2) of SEBI (SAST) Regulations 2011
19-May-2026 | Source : BSEThe Exchange has received the disclosure under Regulation 29(2) of SEBI (Substantial Acquisition of Shares & Takeovers) Regulations 2011 for Govind Gadgil & PACs
Disclosures under Reg. 29(1) of SEBI (SAST) Regulations 2011
19-May-2026 | Source : BSEThe Exchange has received the disclosure under Regulation 29(1) of SEBI (Substantial Acquisition of Shares & Takeovers) Regulations 2011 for Govind Gadgil & Amit Modak
Corporate Actions

No Upcoming Board Meetings

No Dividend history available

No Splits history available

No Bonus history available

No Rights history available
Quality key factors
Valuation key factors
Technicals key factors
 Technical Indicator Scale: Bearish, Mildly Bearish, Sideways, Mildly Bullish, Bullish Turned
 Shareholding Snapshot : Mar 2026
Shareholding Compare (%holding)
Promoters
None
Held by 2 Schemes (4.53%)
Held by 7 FIIs (5.27%)
Renu Govind Gadgil (24.45%)
Tata Mutual Fund- Tata Value Fund (4.04%)
12.24%
Quarterly Results Snapshot (Standalone) - Mar'26 - QoQ

QoQ Growth in quarter ended Mar 2026 is -4.20% vs 40.02% in Dec 2025
QoQ Growth in quarter ended Mar 2026 is -7.36% vs 82.26% in Dec 2025
Annual Results Snapshot (Standalone) - Mar'26
Not Applicable: The company has declared_date for only one period
Not Applicable: The company has declared_date for only one period
About PNGS Reva Diamond Jewellery Limited

Company Coordinates


