
Compare POCL Enterprises with Similar Stocks
Stock DNA
Commodity Chemicals
INR 498 Cr (Micro Cap)
12.00
14
0.67%
0.57
20.66%
2.60
Total Returns (Price + Dividend) 
Latest dividend: 0.4 per share ex-dividend date: Nov-20-2025
Risk Adjusted Returns v/s
Returns Beta

News
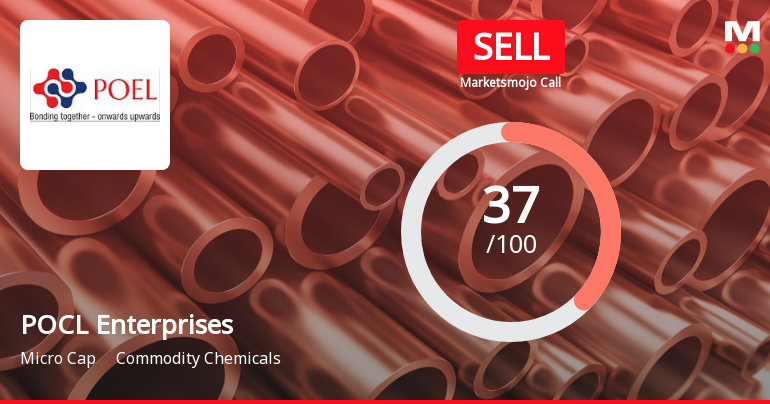
POCL Enterprises Ltd is Rated Sell
POCL Enterprises Ltd is rated Sell by MarketsMOJO, with this rating last updated on 17 Nov 2025. However, the analysis and financial metrics discussed here reflect the stock’s current position as of 09 June 2026, providing investors with an up-to-date view of the company’s fundamentals, returns, and market performance.
Read full news article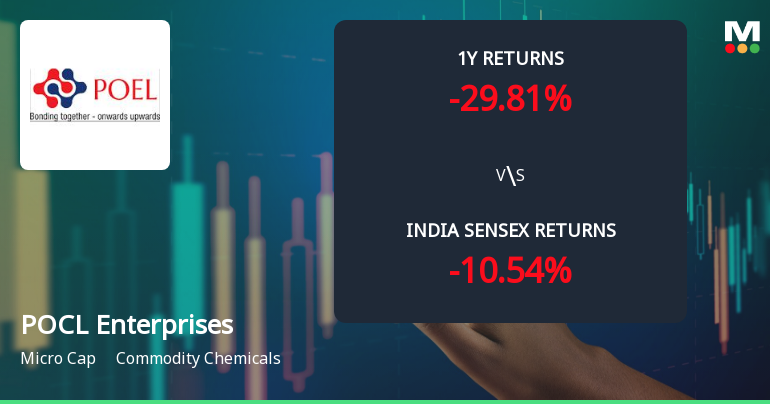
POCL Enterprises Ltd Faces Bearish Momentum Amid Technical Downgrade
POCL Enterprises Ltd, a micro-cap player in the commodity chemicals sector, has seen a notable shift in its technical momentum, with key indicators signalling a bearish trend. The company’s MarketsMOJO grade was downgraded from Hold to Sell on 17 Nov 2025, reflecting deteriorating technical conditions and subdued price performance relative to the broader market.
Read full news article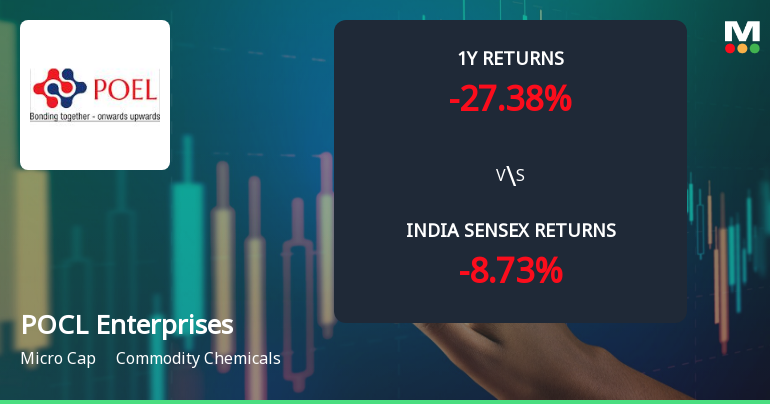
POCL Enterprises Ltd Technical Momentum Shifts Amid Bearish Sentiment
POCL Enterprises Ltd, a micro-cap player in the commodity chemicals sector, has experienced a notable shift in its technical momentum, reflecting a complex interplay of bearish and mildly bullish signals. Despite a recent downgrade from Hold to Sell by MarketsMOJO, the stock’s long-term performance remains impressive, though near-term indicators suggest caution for investors.
Read full news article Announcements
Announcement under Regulation 30 (LODR)-Newspaper Publication
04-Jun-2026 | Source : BSENews paper advertisement regarding opening of special window for transfer and dematerialization of physical shares in accordance with SEBI Circular No.HO/38/13/11/(2)2026- MIRSD-POD/I/3750/2026 dated January 30 2026
Announcement under Regulation 30 (LODR)-Newspaper Publication
26-May-2026 | Source : BSENews paper advertisement for the audited standalone and consolidated financial results for the quarter and year ended March 31 2026 are enclosed.
Announcement under Regulation 30 (LODR)-Investor Presentation
25-May-2026 | Source : BSEThe Result Presentation for the Quarter and Year ended March 31 2026 is enclosed herewith.
Corporate Actions

No Upcoming Board Meetings

POCL Enterprises Ltd has declared 20% dividend, ex-date: 20 Nov 25

POCL Enterprises Ltd has announced 2:10 stock split, ex-date: 25 Oct 24

No Bonus history available

No Rights history available
Quality key factors
Valuation key factors
Technicals key factors
 Technical Indicator Scale: Bearish, Mildly Bearish, Sideways, Mildly Bullish, Bullish Turned
 Shareholding Snapshot : Mar 2026
Shareholding Compare (%holding)
Non Institution
None
Held by 0 Schemes
Held by 1 FIIs (0.24%)
Neelam Bansal (10.05%)
Naresh Kumar Ghogar (2.58%)
51.89%
Quarterly Results Snapshot (Standalone) - Mar'26 - QoQ

QoQ Growth in quarter ended Mar 2026 is -8.82% vs 0.52% in Dec 2025

QoQ Growth in quarter ended Mar 2026 is 13.98% vs -12.81% in Dec 2025
Half Yearly Results Snapshot (Standalone) - Sep'25
Growth in half year ended Sep 2025 is -0.22% vs 32.33% in Sep 2024
Growth in half year ended Sep 2025 is 34.59% vs 146.51% in Sep 2024
Nine Monthly Results Snapshot (Standalone) - Dec'25
YoY Growth in nine months ended Dec 2025 is 2.01% vs 32.60% in Dec 2024
YoY Growth in nine months ended Dec 2025 is 39.05% vs 94.13% in Dec 2024
Annual Results Snapshot (Standalone) - Mar'26
YoY Growth in year ended Mar 2026 is -1.27% vs 29.42% in Mar 2025
YoY Growth in year ended Mar 2026 is 27.04% vs 75.76% in Mar 2025
About POCL Enterprises Ltd

Company Coordinates


