
Compare Primo Chemicals with Similar Stocks
Dashboard
Poor long term growth as Operating profit has grown by an annual rate -30.88% of over the last 5 years
- PBT LESS OI(Q) At Rs 2.16 cr has Grown at 1083.6% (vs previous 4Q average)
- DEBT-EQUITY RATIO(HY) Lowest at 0.32 times
- OPERATING PROFIT TO INTEREST(Q) Highest at 4.90 times
With ROCE of 2.9, it has a Attractive valuation with a 1.3 Enterprise value to Capital Employed
Majority shareholders : Non Institution
Below par performance in long term as well as near term
Stock DNA
Commodity Chemicals
INR 575 Cr (Micro Cap)
36.00
47
0.00%
0.31
3.83%
1.39
Total Returns (Price + Dividend) 
Primo Chemicals for the last several years.
Risk Adjusted Returns v/s
Returns Beta

News
Primo Chemicals Ltd is Rated Hold
Primo Chemicals Ltd is rated 'Hold' by MarketsMOJO, with this rating last updated on 22 June 2026. However, the analysis and financial metrics discussed here reflect the stock's current position as of 15 July 2026, providing investors with an up-to-date view of the company’s fundamentals, returns, and market performance.
Read full news article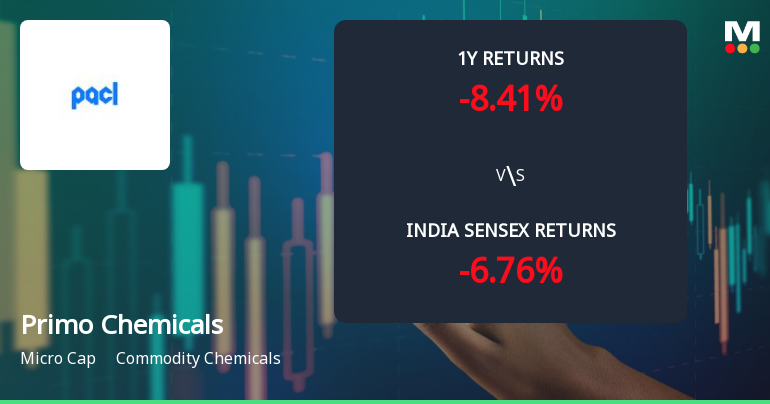
Primo Chemicals Ltd Technical Momentum Shifts Amid Mixed Market Signals
Primo Chemicals Ltd, a micro-cap player in the commodity chemicals sector, has experienced a nuanced shift in its technical momentum, moving from a bullish to a mildly bullish stance. Despite a slight dip in its share price, the stock’s technical indicators reveal a complex interplay of signals that investors should carefully analyse amid broader market trends.
Read full news article
Primo Chemicals Ltd Technical Momentum Shifts to Bullish Amid Mixed Returns
Primo Chemicals Ltd, a micro-cap player in the commodity chemicals sector, has witnessed a notable shift in its technical momentum from mildly bullish to bullish, reflecting evolving market sentiment. Despite a modest day gain of 1.73%, the stock’s technical indicators present a nuanced picture, with some signals strengthening while others remain neutral or bearish. This article analyses the recent technical parameter changes, price momentum, and how these developments position Primo Chemicals relative to broader market trends and its historical performance.
Read full news article Announcements
Corporate Actions

No Upcoming Board Meetings

No Dividend history available

Primo Chemicals Ltd has announced 2:10 stock split, ex-date: 27 Jan 22

No Bonus history available

No Rights history available
Quality key factors
Valuation key factors
Technicals key factors
 Technical Indicator Scale: Bearish, Mildly Bearish, Sideways, Mildly Bullish, Bullish Turned
 Shareholding Snapshot : Mar 2026
Shareholding Compare (%holding)
Non Institution
None
Held by 11 Schemes (1.9%)
Held by 6 FIIs (0.08%)
Sukhbir Singh Dahiya (10.43%)
Naveen Chopra (16.51%)
27.23%
Quarterly Results Snapshot (Consolidated) - Mar'26 - QoQ

QoQ Growth in quarter ended Mar 2026 is 3.37% vs 4.01% in Dec 2025

QoQ Growth in quarter ended Mar 2026 is 478.10% vs -74.76% in Dec 2025
Half Yearly Results Snapshot (Consolidated) - Sep'25
Growth in half year ended Sep 2025 is 7.96% vs 26.20% in Sep 2024
Growth in half year ended Sep 2025 is 390.48% vs 109.75% in Sep 2024
Nine Monthly Results Snapshot (Consolidated) - Dec'25
YoY Growth in nine months ended Dec 2025 is 4.17% vs 35.87% in Dec 2024
YoY Growth in nine months ended Dec 2025 is 134.01% vs 112.25% in Dec 2024
Annual Results Snapshot (Consolidated) - Mar'26
YoY Growth in year ended Mar 2026 is 1.10% vs 39.95% in Mar 2025
YoY Growth in year ended Mar 2026 is 331.74% vs 114.05% in Mar 2025
About Primo Chemicals Ltd

Company Coordinates


