
Compare Poly Medicure with Similar Stocks
Stock DNA
Healthcare Services
INR 15,417 Cr (Small Cap)
47.00
92
0.23%
-0.15
10.53%
4.94
Total Returns (Price + Dividend) 
Latest dividend: 3.5 per share ex-dividend date: Sep-18-2025
Risk Adjusted Returns v/s
Returns Beta

News

Poly Medicure Ltd is Rated Sell
Poly Medicure Ltd is rated 'Sell' by MarketsMOJO, with this rating last updated on 11 February 2026. However, the analysis and financial metrics discussed here reflect the stock's current position as of 13 June 2026, providing investors with an up-to-date view of the company’s fundamentals, returns, and market performance.
Read full news article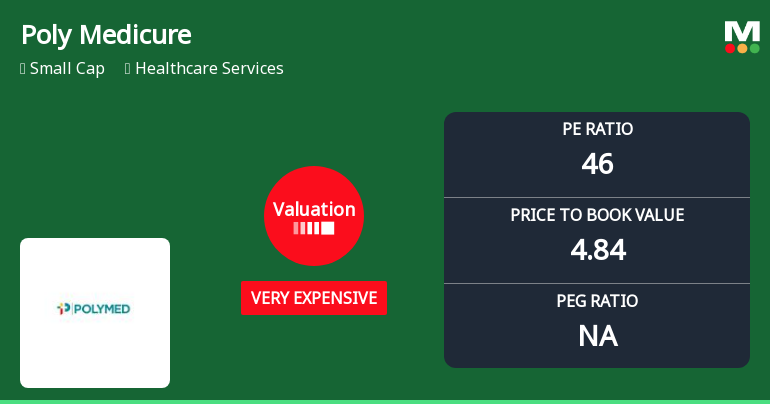
Poly Medicure Ltd Valuation Shifts Signal Heightened Price Risk Amid Healthcare Sector Dynamics
Poly Medicure Ltd, a small-cap player in the healthcare services sector, has seen a marked shift in its valuation parameters, moving from an already expensive rating to a very expensive classification. This change, coupled with a recent upgrade in its Mojo Grade from Strong Sell to Sell, underscores a complex valuation landscape that investors must carefully navigate amid broader market and sector trends.
Read full news article
Poly Medicure Ltd is Rated Sell
Poly Medicure Ltd is rated 'Sell' by MarketsMOJO, with this rating last updated on 11 February 2026. However, the analysis and financial metrics discussed here reflect the stock's current position as of 02 June 2026, providing investors with an up-to-date view of the company's performance and outlook.
Read full news article Announcements
Intimation Of Investor/Analyst Meet
12-Jun-2026 | Source : BSEenclosed
Investors/Analysts Meet Schedule
10-Jun-2026 | Source : BSEenclosed
Intimation Of Analyst/Investor Meet
03-Jun-2026 | Source : BSEThe Company informed about the Analyst/Investor Meet to be held on 08th June 2026.
Corporate Actions

No Upcoming Board Meetings

Poly Medicure Ltd has declared 70% dividend, ex-date: 18 Sep 25

Poly Medicure Ltd has announced 5:10 stock split, ex-date: 02 Feb 15

Poly Medicure Ltd has announced 1:1 bonus issue, ex-date: 24 Mar 17

No Rights history available
Quality key factors
Valuation key factors
Technicals key factors
 Technical Indicator Scale: Bearish, Mildly Bearish, Sideways, Mildly Bullish, Bullish Turned
 Shareholding Snapshot : Mar 2026
Shareholding Compare (%holding)
Promoters
None
Held by 23 Schemes (8.84%)
Held by 102 FIIs (5.91%)
Ezekiel Global Business Solutions Llp (12.2%)
Quant Mutual Fund - Qsif Hybrid Long-short Fund (4.61%)
12.61%
Quarterly Results Snapshot (Consolidated) - Mar'26 - YoY

YoY Growth in quarter ended Mar 2026 is 21.25% vs 16.60% in Mar 2025

YoY Growth in quarter ended Mar 2026 is -27.81% vs 34.33% in Mar 2025
Half Yearly Results Snapshot (Consolidated) - Sep'25
Growth in half year ended Sep 2025 is 5.26% vs 22.29% in Sep 2024
Growth in half year ended Sep 2025 is 14.51% vs 29.31% in Sep 2024
Nine Monthly Results Snapshot (Consolidated) - Dec'25
YoY Growth in nine months ended Dec 2025 is 9.09% vs 23.18% in Dec 2024
YoY Growth in nine months ended Dec 2025 is 3.70% vs 29.91% in Dec 2024
Annual Results Snapshot (Consolidated) - Mar'26
YoY Growth in year ended Mar 2026 is 12.30% vs 21.37% in Mar 2025
YoY Growth in year ended Mar 2026 is -4.85% vs 31.09% in Mar 2025
About Poly Medicure Ltd

Company Coordinates


