
Compare Pondy Oxides with Similar Stocks
Dashboard
High Management Efficiency with a high ROCE of 15.61%
Strong ability to service debt as the company has a low Debt to EBITDA ratio of 0.72 times
Healthy long term growth as Net Sales has grown by an annual rate of 38.51% and Operating profit at 78.31%
With a growth in Net Sales of 19.91%, the company declared Outstanding results in Mar 26
Majority shareholders : Non Institution
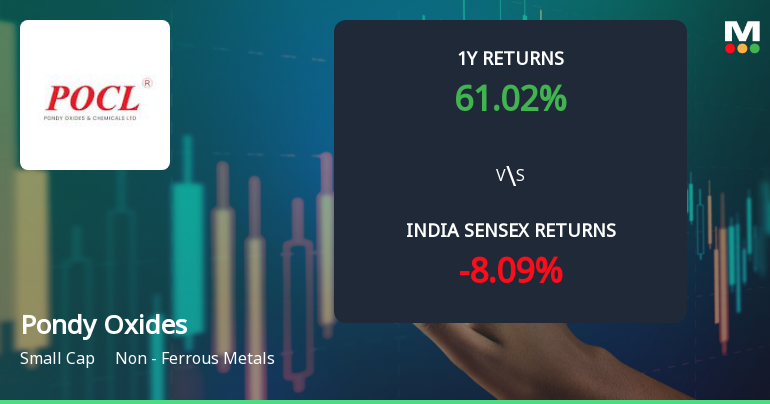
Consistent Returns over the last 3 years
Stock DNA
Non - Ferrous Metals
INR 4,272 Cr (Small Cap)
33.00
45
0.25%
0.18
16.82%
5.39
Total Returns (Price + Dividend) 
Latest dividend: 3.5 per share ex-dividend date: Sep-11-2025
Risk Adjusted Returns v/s
Returns Beta

News
Pondy Oxides & Chemicals Ltd: Technical Momentum Shifts Signal Cautious Optimism
Pondy Oxides & Chemicals Ltd, a small-cap player in the Non-Ferrous Metals sector, has experienced a nuanced shift in its technical momentum, reflecting a transition from a bullish to a mildly bullish trend. Despite a marginal day decline of 0.04%, the stock’s technical indicators present a complex picture, with some signals suggesting caution while others maintain a positive outlook. This article analyses the recent technical parameter changes, key momentum indicators, and the stock’s performance relative to the broader market.
Read full news article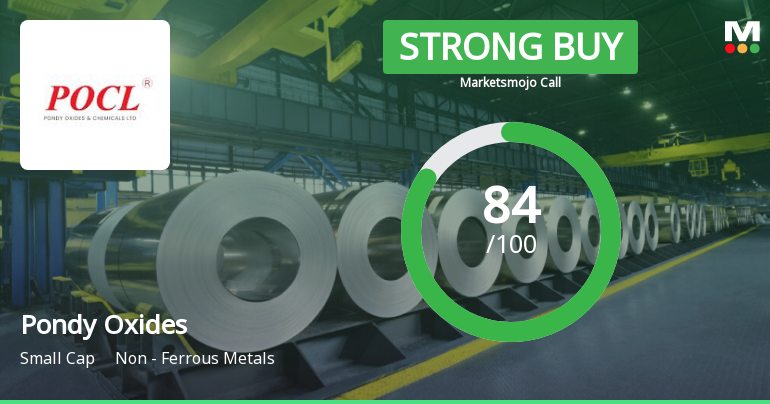
Pondy Oxides & Chemicals Ltd Upgraded to Strong Buy on Robust Fundamentals and Technicals
Pondy Oxides & Chemicals Ltd has been upgraded from a Buy to a Strong Buy rating as of 30 June 2026, reflecting significant improvements across quality, valuation, financial trends, and technical indicators. The company’s stellar quarterly performance, sustained growth trajectory, and bullish technical signals have collectively driven this positive reassessment, positioning it favourably within the non-ferrous metals sector.
Read full news article
Pondy Oxides & Chemicals Ltd Sees Bullish Momentum Shift Amid Strong Technical Signals
Pondy Oxides & Chemicals Ltd has demonstrated a notable shift in technical momentum, with key indicators signalling a transition from mildly bullish to a more confident bullish trend. The stock’s recent price action, combined with mixed but improving technical signals, suggests growing investor optimism amid a strong fundamental backdrop.
Read full news article Announcements
Announcement under Regulation 30 (LODR)-Analyst / Investor Meet - Intimation
01-Jul-2026 | Source : BSEIntimation of investor meetings scheduled on Monday 06th July 2026 and Wednesday 08th July 2026
Disclosures under Reg. 29(2) of SEBI (SAST) Regulations 2011
01-Jul-2026 | Source : BSEThe Exchange has received the disclosure under Regulation 29(2) of SEBI (Substantial Acquisition of Shares & Takeovers) Regulations 2011 for Manju Bansal
Disclosure Under Regulation 7(2) Of The SEBI (Prohibition Of Insider Trading) Regulations 2015
30-Jun-2026 | Source : BSEDisclosure under Regulation 7(2) of the SEBI (Prohibition of Insider Trading) Regulations 2015
Corporate Actions

No Upcoming Board Meetings

Pondy Oxides & Chemicals Ltd has declared 70% dividend, ex-date: 11 Sep 25

Pondy Oxides & Chemicals Ltd has announced 5:10 stock split, ex-date: 16 Oct 24

Pondy Oxides & Chemicals Ltd has announced 1:1 bonus issue, ex-date: 28 Sep 22

Pondy Oxides & Chemicals Ltd has announced 2:3 rights issue, ex-date: 23 Jun 06
Quality key factors
Valuation key factors
Technicals key factors
 Technical Indicator Scale: Bearish, Mildly Bearish, Sideways, Mildly Bullish, Bullish Turned
 Shareholding Snapshot : Mar 2026
Shareholding Compare (%holding)
Non Institution
None
Held by 1 Schemes (1.73%)
Held by 44 FIIs (2.22%)
Ashish Bansal (15.2%)
Maneesh Parmar (3.35%)
39.81%
Quarterly Results Snapshot (Consolidated) - Mar'26 - QoQ

QoQ Growth in quarter ended Mar 2026 is 19.91% vs 21.79% in Dec 2025

QoQ Growth in quarter ended Mar 2026 is 6.29% vs 4.25% in Dec 2025
Half Yearly Results Snapshot (Consolidated) - Sep'25
Growth in half year ended Sep 2025 is 21.40% vs 41.88% in Sep 2024
Growth in half year ended Sep 2025 is 109.29% vs 188.15% in Sep 2024
Nine Monthly Results Snapshot (Consolidated) - Dec'25
YoY Growth in nine months ended Dec 2025 is 31.95% vs 30.03% in Dec 2024
YoY Growth in nine months ended Dec 2025 is 127.68% vs 108.03% in Dec 2024
Annual Results Snapshot (Consolidated) - Mar'26
YoY Growth in year ended Mar 2026 is 43.83% vs 33.42% in Mar 2025
YoY Growth in year ended Mar 2026 is 127.17% vs 82.15% in Mar 2025
About Pondy Oxides & Chemicals Ltd

Company Coordinates


