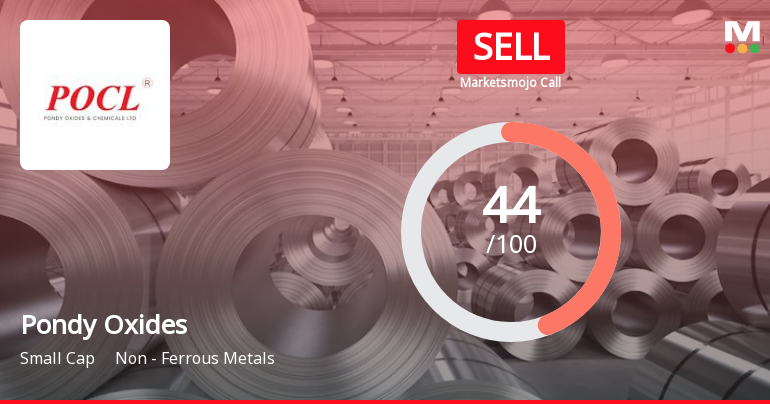
Pondy Oxides

  • Market Cap: Small Cap
  • Industry: Non - Ferrous Metals
  • ISIN: INE063E01061
  • NSEID: POCL
  • BSEID: 532626
INR
482.00
-4.65 (-0.96%)
BSENSE

Aug 07, 03:30 PM

BSE+NSE Vol: 6.3 lacs

  • Price Points
  • Score
  • Mojo Parameters
  • Total Return
  • News and Corporate Actions
  • Key factors
  • Shareholding
  • Financials
  • CompanyCV
stock-summaryPrice Point
High/Low

1Day

52 Week

Valuation
Technical
Day's Volume

CASH

6.3 lacs (-39.56%) Volume

Shareholding (Jun 2026)

FII

3.14%

Held by 45 FIIs

DII

7.50%

Held by 3 DIIs

Promoter

36.39%

Why is Pondy Oxides & Chemicals Ltd falling/rising?

10-Aug-2026

As of 09-Aug, Pondy Oxides & Chemicals Ltd's stock price is declining, currently at Rs 482.00, down 0.96% and part of a broader trend with a 12% drop over four days. Despite recent poor performance, the stock has shown significant long-term growth and increased investor interest.

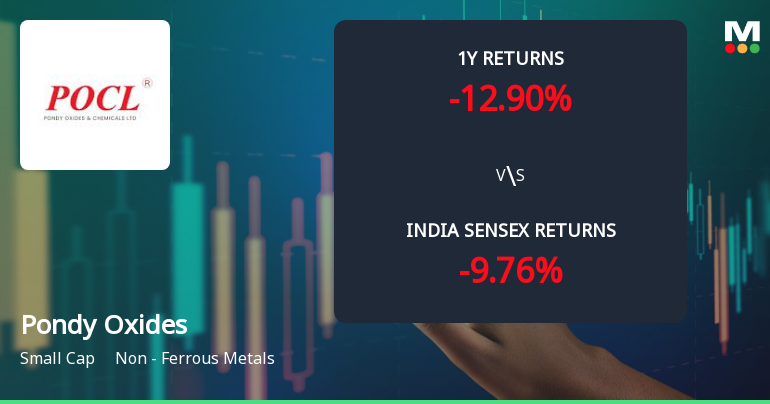
As of 09-Aug, Pondy Oxides & Chemicals Ltd is experiencing a decline in its stock price, currently at Rs 482.00, which reflects a decrease of Rs 4.65 or 0.96%. This downward movement is part of a broader trend, as the stock has been falling for the last four consecutive days, resulting in a total decline of 12% during this period. Additionally, the stock has underperformed compared to the sector by 0.39% today.<BR><BR>Over the past week, the stock has decreased by 8.21%, while the benchmark Sensex has increased by 0.52%. In the last month, the stock has fallen by 15.60%, contrasting with a slight gain of 0.41% in the Sensex. Year-to-date, the stock is down 17.28%, while the Sensex has decreased by only 7.89%. Despite these recent declines, it is noteworthy that the stock has shown a positive performance over the longer term, with a remarkable increase of 402.82% over the past three years and 941.49% over the last five years.<BR><BR>The current trading conditions indicate that Pondy Oxides is trading below its moving averages across various time frames, which may contribute to the negative sentiment surrounding the stock. However, there is a notable increase in investor participation, as evidenced by a delivery volume of 11.73 lacs on August 6, which is 229.65% higher than the five-day average. This suggests that while the stock price is falling, there is still significant interest from investors.<BR><BR>In summary, the stock of Pondy Oxides & Chemicals Ltd is currently falling due to a combination of recent poor performance relative to the market and its moving averages, despite strong long-term growth metrics and increasing investor participation.

View full answer

Are Pondy Oxides & Chemicals Ltd latest results good or bad?

05-Aug-2026

Pondy Oxides & Chemicals Ltd's latest Q1 FY27 results show strong year-on-year growth with a net profit increase of 42.55% and revenue up 55.08%. However, concerns arise from a contraction in operating margin and a sequential profit decline of 4.40%, indicating potential short-term challenges.

Pondy Oxides & Chemicals Ltd's latest results for Q1 FY27 show a mixed performance. On the positive side, the company reported a net profit of ₹35.88 crores, which is a significant increase of 42.55% year-on-year. Additionally, revenue surged to ₹934.89 crores, reflecting a robust growth of 55.08% compared to the same quarter last year.<BR><BR>However, there are some concerns to note. The operating margin has contracted to 5.97%, down from 6.79% in the previous year, indicating some pressure on profitability. Furthermore, the net profit saw a sequential decline of 4.40% from ₹37.53 crores in the previous quarter, suggesting some short-term challenges.<BR><BR>Overall, while the company has demonstrated strong year-on-year growth in both revenue and profit, the margin compression and sequential profit decline raise questions about its near-term operational efficiency. Investors should keep an eye on these trends as they evaluate the company's performance.

View full answer

Should I buy, sell or hold Pondy Oxides & Chemicals Ltd?

05-Aug-2026

When is the next results date for Pondy Oxides & Chemicals Ltd?

22-Jul-2026

The next results date for Pondy Oxides & Chemicals Ltd is August 4, 2026.

The next results date for Pondy Oxides & Chemicals Ltd is scheduled for August 4, 2026.

View full answer

How big is Pondy Oxides?

11-Jun-2026

As of 10th June, Pondy Oxides & Chemicals Ltd has a market capitalization of 3,735.00 Cr, with recent Net Sales of 2,958.36 Cr and a Net Profit of 131.88 Cr.

As of 10th June, Pondy Oxides & Chemicals Ltd has a market capitalization of 3,735.00 Cr, categorizing it as a Small Cap company.<BR><BR>In the latest four quarters, the company reported Net Sales of 2,958.36 Cr and a Net Profit of 131.88 Cr.<BR><BR>The latest annual reporting period for the balance sheet is March 2025, with Shareholder's Funds amounting to 592.91 Cr and Total Assets totaling 731.50 Cr.

View full answer

Who are in the management team of Pondy Oxides?

11-Jun-2026

The management team of Pondy Oxides includes Anil Kumar Bansal (Chairman & Wholetime Director), Ashish Bansal (Managing Director), A Vijay Anand, M Ramasubramani, and Shoba Ramakrishnan (all Independent Directors), along with Kumaravel Krishnamoorthi (Director of Finance & Company Secretary). They are responsible for the company's strategic direction and governance.

The management team of Pondy Oxides includes the following individuals:<BR><BR>1. **Anil Kumar Bansal** - Chairman & Wholetime Director<BR>2. **Ashish Bansal** - Managing Director<BR>3. **A Vijay Anand** - Independent Director<BR>4. **M Ramasubramani** - Independent Director<BR>5. **Kumaravel Krishnamoorthi** - Director (Finance) & Company Secretary<BR>6. **Shoba Ramakrishnan** - Independent Director<BR><BR>These members play key roles in guiding the company's strategic direction and governance.

View full answer

Who are the peers of the Pondy Oxides?

11-Jun-2026

Pondy Oxides' peers include Vedanta, National Aluminium, Hindustan Copper, and others, with varying management and growth risks. Bhagyanagar Industries leads in 1-year returns at 288.18%, while Pondy Oxides has a return of 55.39%.

Peers: The peers of Pondy Oxides are Vedanta, Natl. Aluminium, Hindustan Copper, Lloyds Enterpris, Dec.Gold Mines, Arfin India, Bhagyanagar Ind, Maan Aluminium, and Divine Power.<BR><BR>Quality Snapshot: Excellent management risk is observed at Vedanta and Natl. Aluminium, while Good management risk is found at Hindustan Copper and Pondy Oxides. Average management risk is present at Lloyds Enterpris, Arfin India, Maan Aluminium, and Divine Power, whereas Below Average management risk is noted at Dec.Gold Mines and Bhagyanagar Ind. Growth is Excellent at Pondy Oxides, Lloyds Enterpris, and Bhagyanagar Ind, while Good growth is seen at Natl. Aluminium and Hindustan Copper. Below Average growth is reported at Dec.Gold Mines and Maan Aluminium, with Average growth at Arfin India. Capital Structure is Excellent at Natl. Aluminium, Hindustan Copper, and Lloyds Enterpris, while Good capital structure is found at Pondy Oxides and Maan Aluminium. Below Average capital structure is noted at Dec.Gold Mines, Arfin India, and Bhagyanagar Ind.<BR><BR>Return Snapshot: The peer with the highest 1-year return is Bhagyanagar Ind at 288.18%, while the lowest is Lloyds Enterpris at -10.19%. Pondy Oxides has a 1-year return of 55.39%, which is significantly higher than Lloyds Enterpris but lower than Bhagyanagar Ind. Additionally, the six-month return is negative for Pondy Oxides, Lloyds Enterpris, and Maan Aluminium.

View full answer

What does Pondy Oxides do?

10-Jun-2026

Pondy Oxides & Chemicals Ltd is a small-cap company in the Non-Ferrous Metals industry, primarily manufacturing Zinc Oxide and trading zinc and lead sub-oxide. As of March 2026, it reported net sales of ₹935 Cr and a net profit of ₹38 Cr, with a market cap of ₹3,735 Cr.

Overview:<BR>Pondy Oxides & Chemicals Ltd operates in the Non-Ferrous Metals industry as a small-cap company, primarily engaged in the manufacture of Zinc Oxide and trading of zinc and lead sub-oxide.<BR><BR>History:<BR>Pondy Oxides & Chemicals Ltd was incorporated in 1995 to take over the business of a partnership firm established in 1992. The company began trading in zinc and lead sub-oxide in July 1993. The latest quarterly results reported net sales and net profit for March 2026.<BR><BR>Financial Snapshot:<BR>- Net Sales: 935 Cr (Quarterly Results - Mar 2026)<BR>- Net Profit: 38 Cr (Quarterly Results - Mar 2026)<BR>- Market Cap: INR 3,735 Cr (Small Cap)<BR><BR>Key Metrics:<BR>- P/E: 28.00<BR>- Industry P/E: 42<BR>- Dividend Yield: 0.28%<BR>- Debt Equity: 0.18<BR>- Return on Equity: 16.82%<BR>- Price to Book: 4.79<BR><BR>Contact Details:<BR>Address: KRM Centre 4th Floor, No 2 Harrington Road Chetpet Chennai Tamil Nadu : 600031<BR>Tel: 91-044-42965454<BR>Email: kk@pocl.co.in<BR>Website: http://www.pocl.co.in

View full answer

Is Pondy Oxides technically bullish or bearish?

21-Nov-2025

As of November 20, 2025, the trend is mildly bullish, supported by positive MACD and moving averages, but tempered by mildly bearish KST signals, suggesting a cautious outlook.

As of 20 November 2025, the technical trend has changed from bullish to mildly bullish. The current stance is mildly bullish, supported by the weekly and monthly MACD readings, which are both bullish. The daily moving averages also indicate a bullish trend. However, the KST shows a mildly bearish signal on both weekly and monthly time frames, which tempers the overall bullish sentiment. The Bollinger Bands and OBV are mildly bullish on both weekly and monthly time frames, reinforcing the positive outlook. Overall, while the indicators suggest a mildly bullish stance, the presence of bearish signals in KST indicates caution.

View full answer

Is Pondy Oxides overvalued or undervalued?

20-Nov-2025

As of November 19, 2025, Pondy Oxides is considered overvalued with a PE ratio of 47.65 and a valuation grade of expensive, despite a strong year-to-date return of 62.36%, as it exceeds industry norms and is higher than peers like Godrej Industries and Deepak Nitrite.

As of 19 November 2025, the valuation grade for Pondy Oxides has moved from very expensive to expensive, indicating a slight improvement in perceived value. However, the company remains overvalued based on its current financial metrics. The PE ratio stands at 47.65, the Price to Book Value is 6.17, and the EV to EBITDA is 28.22, all of which are significantly higher than industry norms.<BR><BR>In comparison to its peers, Pondy Oxides' PE ratio is notably higher than Godrej Industries at 37.28 and Deepak Nitrite at 43.97, both of which are classified as expensive. Additionally, the PEG ratio of Pondy Oxides is 0.94, suggesting that while growth expectations are reasonable, the current valuation does not adequately reflect this. Despite a strong performance relative to the Sensex, with a year-to-date return of 62.36% compared to the Sensex's 9.02%, the overall assessment indicates that Pondy Oxides is overvalued in its current market position.

View full answer

How has been the historical performance of Pondy Oxides?

17-Oct-2025

Pondy Oxides has shown significant growth in net sales and profitability, with net sales increasing from 1,541.68 Cr in March 2024 to 2,056.91 Cr in March 2025, and profit after tax rising to 58.05 Cr from 31.87 Cr. Despite rising raw material costs, the company improved operational efficiency, reflected in increased operating profit and manageable debt levels.

Answer:<BR>The historical performance of Pondy Oxides shows significant growth in net sales and profitability over the years, particularly from March 2024 to March 2025.<BR><BR>Breakdown:<BR>Pondy Oxides experienced a substantial increase in net sales, rising from 1,541.68 Cr in March 2024 to 2,056.91 Cr in March 2025. This growth is reflected in the total operating income, which also increased to 2,056.91 Cr in March 2025 from 1,541.68 Cr in the previous year. The raw material costs surged to 1,844.00 Cr in March 2025, up from 1,319.69 Cr in March 2024, contributing to total expenditures of 1,952.05 Cr. Despite these rising costs, the operating profit (PBDIT) increased to 107.11 Cr in March 2025, compared to 74.38 Cr in March 2024, indicating improved operational efficiency. Profit before tax rose to 78.28 Cr in March 2025 from 44.01 Cr in March 2024, while profit after tax also saw an increase to 58.05 Cr from 31.87 Cr. The company's total assets grew to 731.50 Cr in March 2025, up from 476.66 Cr in March 2024, alongside total liabilities of 111.97 Cr, reflecting a manageable debt level. Cash flow from financing activities showed a positive trend with an inflow of 177.00 Cr in March 2025, contributing to a net cash inflow of 28.00 Cr for the year. Overall, Pondy Oxides has demonstrated a robust financial performance with significant growth in sales and profitability over the past year.

View full answer

Who are the top shareholders of the Pondy Oxides?

17-Jul-2025

The top shareholders of Pondy Oxides include promoter Ashish Bansal with 12.29%, individual investors holding 41.84%, and Authum Investment And Infrastructure Limited as the largest public shareholder at 2.81%. Additionally, mutual funds hold 2.17% and 21 foreign institutional investors hold 1.19%, with no pledged promoter holdings reported.

The top shareholders of Pondy Oxides include Ashish Bansal, who is the promoter with the highest holding at 12.29%. The company also has significant individual investor participation, with individual investors holding 41.84% of the shares. Additionally, Authum Investment And Infrastructure Limited is the highest public shareholder, holding 2.81%. The company has mutual funds represented by two schemes, which collectively hold 2.17%, and 21 foreign institutional investors (FIIs) holding 1.19%. There are no pledged promoter holdings reported.

View full answer

What is the bonus history of the Pondy Oxides?

06-Jun-2025

Pondy Oxides has issued bonuses historically, with the most recent being a 1:1 bonus on September 28, 2022, and a prior 1:10 bonus on January 15, 2007. This demonstrates the company's commitment to rewarding its shareholders.

Pondy Oxides has a notable bonus history. The most recent bonus issue was a 1:1 bonus announced with an ex-date of September 28, 2022, and the record date was September 29, 2022. Prior to that, the company issued a 1:10 bonus on January 15, 2007, with a record date of January 20, 2007. This reflects the company's approach to rewarding its shareholders through bonus shares over the years.

View full answer

Has Pondy Oxides declared dividend?

06-Jun-2025

Pondy Oxides & Chemicals Ltd has declared a 50% dividend, amounting to ₹5 per share, with an ex-date of September 11, 2024. The company has shown strong total returns over various periods, particularly a total return of 1818.97% over the past 5 years.

Pondy Oxides & Chemicals Ltd has declared a 50% dividend.<BR><BR>Dividend Details:<BR>- Percentage announced: 50%<BR>- Amount per share: 5<BR>- Ex-date: 11 Sep 24<BR><BR>Dividend Yield: 0.31%<BR><BR>Total Returns by Period:<BR>In the last 6 months, the price return was -15.96%, with no dividend return, resulting in a total return of -15.96%.<BR><BR>Over the past year, the price return was 127.98%, with a dividend return of 1.52%, leading to a total return of 129.5%.<BR><BR>In the 2-year period, the price return was 250.95%, with a dividend return of 4.69%, resulting in a total return of 255.64%.<BR><BR>For the 3-year period, the price return was 414.88%, with a dividend return of 12.74%, culminating in a total return of 427.62%.<BR><BR>In the last 4 years, the price return was 952.92%, with a dividend return of 26.64%, resulting in a total return of 979.56%.<BR><BR>Over the past 5 years, the price return was 1778.02%, with a dividend return of 40.95%, leading to a total return of 1818.97%.<BR><BR>Overall, Pondy Oxides has declared a significant dividend, and the total returns over various periods show strong growth, particularly in the longer term, indicating a positive performance trajectory for the company.

View full answer
iScoreScore
Click here to find our call on this stock
Strong Sell
Sell
Hold
Buy
Strong Buy

Dashboard

1

High Management Efficiency with a high ROCE of 15.61%

 
2

Strong ability to service debt as the company has a low Debt to EBITDA ratio of 0.72 times

 
3

Healthy long term growth as Net Sales has grown by an annual rate of 31.79% and Operating profit at 49.57%

 
4

The company has declared Positive results for the last 9 consecutive quarters

5

With ROCE of 20, it has a Expensive valuation with a 4.1 Enterprise value to Capital Employed

6

Reducing Promoter Confidence

stock-summaryMojo Parameters

Mojo Parameters

Loading Valuation Snapshot...

Stock DNA

stock-summary
Industry

Non - Ferrous Metals

stock-summary
Market cap

INR 3,725 Cr (Small Cap)

stock-summary
P/E

26.00

stock-summary
Industry P/E

44

stock-summary
Dividend Yield

0.29%

stock-summary
Debt Equity

0.18

stock-summary
Return on Equity

16.82%

stock-summary
Price to Book

4.71

Revenue and Profits:
Net Sales:
935 Cr
(Quarterly Results - Jun 2026)
Net Profit:
36 Cr
stock-summaryTotal Returns
Total Returns (Price + Dividend) stock-summary
Dividend Yield (0.29%)
TimePeriod
Price Return
Dividend Return
Total Return
3 Months
-16.14%
0%
-16.14%
6 Months
0.27%
0%
0.27%
1 Year
9.34%
0.34%
9.68%
2 Years
60.69%
0.71%
61.4%
3 Years
402.82%
3.85%
406.67%
4 Years
604.27%
3.99%
608.26%
5 Years
941.49%
9.66%
951.15%

Latest dividend: 1.3999999999999997 per share ex-dividend date: Sep-11-2025

Risk Adjusted Returns v/s stock-summary
Returns Beta
Icon
Beta has not been calculated since enough price history is not available
stock-summaryNews & Corporate Actions

News

Pondy Oxides Drops 8.21% Amid Mixed Technical Signals and Valuation Concerns

Announcements stock-summary

Announcement under Regulation 30 (LODR)-Analyst / Investor Meet - Outcome

05-Aug-2026 | Source : BSE

Audio Recordings of the Investor Call for Q1 FY 2026-27 held on 05th August 2026.

Announcement under Regulation 30 (LODR)-Newspaper Publication

05-Aug-2026 | Source : BSE

Newspaper Publication - Unaudited Standalone & Consolidated Financial Results for the quarter ended 30th June 2026

Intimation Of 31St Annual General Meeting (AGM)

04-Aug-2026 | Source : BSE

31st Annual General Meeting is scheduled on Tuesday 22nd September 2026 at 03:00 PM (IST) through Video Conferencing/ Other Audio Visual Means (VC/OAVM)

Corporate Actions stock-summary

stock-summary
BOARD MEETING

No Upcoming Board Meetings

stock-summary
DIVIDEND

Pondy Oxides & Chemicals Ltd has declared 70% dividend, ex-date: 11 Sep 25

stock-summary
SPLITS

Pondy Oxides & Chemicals Ltd has announced 2:5 stock split, ex-date: 21 Jul 26

stock-summary
BONUS

Pondy Oxides & Chemicals Ltd has announced 1:1 bonus issue, ex-date: 28 Sep 22

stock-summary
RIGHTS

Pondy Oxides & Chemicals Ltd has announced 2:3 rights issue, ex-date: 23 Jun 06

stock-summaryKey Factors

Quality key factors stock-summary

Factor
Value
Sales Growth (5y)
31.79%
EBIT Growth (5y)
49.57%
EBIT to Interest (avg)
9.87
Debt to EBITDA (avg)
1.52
Net Debt to Equity (avg)
0.18
Sales to Capital Employed (avg)
2.88
Tax Ratio
26.11%
Dividend Payout Ratio
16.96%
Pledged Shares
0
Institutional Holding
10.64%
ROCE (avg)
14.07%
ROE (avg)
11.84%

Valuation key factors

Factor
Value
P/E Ratio
26
Industry P/E
44
Price to Book Value
4.68
EV to EBIT
19.27
EV to EBITDA
17.00
EV to Capital Employed
4.12
EV to Sales
1.16
PEG Ratio
0.29
Dividend Yield
0.29%
ROCE (Latest)
19.98%
ROE (Latest)
16.82%

Technicals key factors

Indicator
Weekly
Monthly
MACD
Mildly Bearish
Mildly Bearish
RSI
No Signal
No Signal
Bollinger Bands
Bearish
Mildly Bullish
Moving Averages
Mildly Bullish (Daily)
KST
Mildly Bearish
Mildly Bearish
Dow Theory
Mildly Bearish
Mildly Bullish
OBV
Mildly Bearish
Mildly Bearish
stock-summary Technical Indicator Scale: Bearish, Mildly Bearish, Sideways, Mildly Bullish, Bullish  Turned 
stock-summaryShareholding
Shareholding Snapshot : Jun 2026stock-summary
Shareholding Compare (%holding) stock-summary
Majority shareholders

Non Institution

Pledged Promoter Holdings

None

Mutual Funds

Held by 3 Schemes (3.08%)

FIIs

Held by 45 FIIs (3.14%)

Promoter with highest holding

Ashish Bansal (15.2%)

Highest Public shareholder

Maneesh Parmar. (2.55%)

Individual Investors Holdings

40.25%

stock-summaryFinancial
[
  {
    "link": "quarterly",
    "btn_text": "All Quarterly Results",
    "header": "Quarterly Results Snapshot (Consolidated) - Jun'26 - QoQ",
    "rhs": [
      {
        "prefix": "Net Sales ",
        "suffix": "QoQ Growth in quarter ended Jun 2026 is -0.04% vs 19.91% in Mar 2026",
        "dir": -1
      },
      {
        "prefix": "Consolidated Net Profit ",
        "suffix": "QoQ Growth in quarter ended Jun 2026 is -4.40% vs 6.29% in Mar 2026",
        "dir": -1
      }
    ],
    "table": {
      "header": [
        "Jun'26",
        "Mar'26",
        "Change(%)"
      ],
      "body": [
        {
          "field": "Net Sales",
          "val1": "934.89",
          "val2": "935.23",
          "chgp": "-0.04%",
          "chgp_class": "negative"
        },
        {
          "field": "Operating Profit (PBDIT) excl Other Income",
          "val1": "55.83",
          "val2": "59.22",
          "chgp": "-5.72%",
          "chgp_class": "negative"
        },
        {
          "field": "Interest",
          "val1": "2.49",
          "val2": "3.74",
          "chgp": "-33.42%",
          "chgp_class": "positive"
        },
        {
          "field": "Exceptional Items",
          "val1": "0.00",
          "val2": "-0.93",
          "chgp": "100.00%",
          "chgp_class": "positive"
        },
        {
          "field": "Consolidate Net Profit",
          "val1": "35.88",
          "val2": "37.53",
          "chgp": "-4.40%",
          "chgp_class": "negative"
        },
        {
          "field": "Operating Profit Margin (Excl OI)",
          "val1": "5.97%",
          "val2": "6.33%",
          "chgp": "-0.36%",
          "chgp_class": "negative"
        }
      ]
    }
  },
  {
    "link": "half-yearly",
    "btn_text": "All Half Yearly Results",
    "header": "Half Yearly Results Snapshot (Consolidated) - Sep'25",
    "rhs": [
      {
        "prefix": "Net Sales ",
        "suffix": " Growth in half year ended Sep 2025 is 21.40% vs 41.88% in Sep 2024",
        "dir": -1
      },
      {
        "prefix": "Consolidated Net Profit ",
        "suffix": " Growth in half year ended Sep 2025 is 109.29% vs 188.15% in Sep 2024",
        "dir": -1
      }
    ],
    "table": {
      "header": [
        "Sep'25",
        "Sep'24",
        "Change(%)"
      ],
      "body": [
        {
          "field": "Net Sales",
          "val1": "1,243.20",
          "val2": "1,024.05",
          "chgp": "21.40%",
          "chgp_class": "positive"
        },
        {
          "field": "Operating Profit (PBDIT) excl Other Income",
          "val1": "94.48",
          "val2": "51.78",
          "chgp": "82.46%",
          "chgp_class": "positive"
        },
        {
          "field": "Interest",
          "val1": "4.75",
          "val2": "6.43",
          "chgp": "-26.13%",
          "chgp_class": "positive"
        },
        {
          "field": "Exceptional Items",
          "val1": "0.00",
          "val2": "0.00",
          "chgp": "",
          "chgp_class": "neutral"
        },
        {
          "field": "Consolidate Net Profit",
          "val1": "59.04",
          "val2": "28.21",
          "chgp": "109.29%",
          "chgp_class": "positive"
        },
        {
          "field": "Operating Profit Margin (Excl OI)",
          "val1": "7.60%",
          "val2": "5.06%",
          "chgp": "2.54%",
          "chgp_class": "positive"
        }
      ]
    }
  },
  {
    "link": "nine-monthly",
    "btn_text": "All Nine Monthly Results",
    "header": "Nine Monthly Results Snapshot (Consolidated) - Dec'25",
    "rhs": [
      {
        "prefix": "Net Sales ",
        "suffix": "YoY Growth in nine months ended Dec 2025 is 31.95% vs 30.03% in Dec 2024",
        "dir": 1
      },
      {
        "prefix": "Consolidated Net Profit ",
        "suffix": "YoY Growth in nine months ended Dec 2025 is 127.68% vs 108.03% in Dec 2024",
        "dir": 1
      }
    ],
    "table": {
      "header": [
        "Dec'25",
        "Dec'24",
        "Change(%)"
      ],
      "body": [
        {
          "field": "Net Sales",
          "val1": "2,023.13",
          "val2": "1,533.20",
          "chgp": "31.95%",
          "chgp_class": "positive"
        },
        {
          "field": "Operating Profit (PBDIT) excl Other Income",
          "val1": "151.34",
          "val2": "77.23",
          "chgp": "95.96%",
          "chgp_class": "positive"
        },
        {
          "field": "Interest",
          "val1": "6.65",
          "val2": "10.16",
          "chgp": "-34.55%",
          "chgp_class": "positive"
        },
        {
          "field": "Exceptional Items",
          "val1": "0.00",
          "val2": "0.00",
          "chgp": "",
          "chgp_class": "neutral"
        },
        {
          "field": "Consolidate Net Profit",
          "val1": "94.35",
          "val2": "41.44",
          "chgp": "127.68%",
          "chgp_class": "positive"
        },
        {
          "field": "Operating Profit Margin (Excl OI)",
          "val1": "7.48%",
          "val2": "5.04%",
          "chgp": "2.44%",
          "chgp_class": "positive"
        }
      ]
    }
  },
  {
    "link": "annual",
    "btn_text": "All Annual Results",
    "header": "Annual Results Snapshot (Consolidated) - Mar'26",
    "rhs": [
      {
        "prefix": "Net Sales ",
        "suffix": "YoY Growth in year ended Mar 2026 is 43.83% vs 33.42% in Mar 2025",
        "dir": 1
      },
      {
        "prefix": "Consolidated Net Profit ",
        "suffix": "YoY Growth in year ended Mar 2026 is 127.17% vs 82.15% in Mar 2025",
        "dir": 1
      }
    ],
    "table": {
      "header": [
        "Mar'26",
        "Mar'25",
        "Change(%)"
      ],
      "body": [
        {
          "field": "Net Sales",
          "val1": "2,958.36",
          "val2": "2,056.91",
          "chgp": "43.83%",
          "chgp_class": "positive"
        },
        {
          "field": "Operating Profit (PBDIT) excl Other Income",
          "val1": "210.58",
          "val2": "104.86",
          "chgp": "100.82%",
          "chgp_class": "positive"
        },
        {
          "field": "Interest",
          "val1": "10.39",
          "val2": "12.18",
          "chgp": "-14.70%",
          "chgp_class": "positive"
        },
        {
          "field": "Exceptional Items",
          "val1": "-0.93",
          "val2": "0.00",
          "chgp": "",
          "chgp_class": "neutral"
        },
        {
          "field": "Consolidate Net Profit",
          "val1": "131.87",
          "val2": "58.05",
          "chgp": "127.17%",
          "chgp_class": "positive"
        },
        {
          "field": "Operating Profit Margin (Excl OI)",
          "val1": "7.12%",
          "val2": "5.10%",
          "chgp": "2.02%",
          "chgp_class": "positive"
        }
      ]
    }
  }
]

Quarterly Results Snapshot (Consolidated) - Jun'26 - QoQstock-summary

Jun'26
Mar'26
Change(%)
Net Sales
934.89
935.23
-0.04%
Operating Profit (PBDIT) excl Other Income
55.83
59.22
-5.72%
Interest
2.49
3.74
-33.42%
Exceptional Items
0.00
-0.93
100.00%
Consolidate Net Profit
35.88
37.53
-4.40%
Operating Profit Margin (Excl OI)
5.97%
6.33%
-0.36%
Values in Rs Cr.
Direction Arrows
Net Sales

QoQ Growth in quarter ended Jun 2026 is -0.04% vs 19.91% in Mar 2026

Direction Arrows
Consolidated Net Profit

QoQ Growth in quarter ended Jun 2026 is -4.40% vs 6.29% in Mar 2026

Half Yearly Results Snapshot (Consolidated) - Sep'25stock-summary

Sep'25
Sep'24
Change(%)
Net Sales
1,243.20
1,024.05
21.40%
Operating Profit (PBDIT) excl Other Income
94.48
51.78
82.46%
Interest
4.75
6.43
-26.13%
Exceptional Items
0.00
0.00
Consolidate Net Profit
59.04
28.21
109.29%
Operating Profit Margin (Excl OI)
7.60%
5.06%
2.54%
Values in Rs Cr.
Direction Arrows
Net Sales

Growth in half year ended Sep 2025 is 21.40% vs 41.88% in Sep 2024

Direction Arrows
Consolidated Net Profit

Growth in half year ended Sep 2025 is 109.29% vs 188.15% in Sep 2024

Nine Monthly Results Snapshot (Consolidated) - Dec'25stock-summary

Dec'25
Dec'24
Change(%)
Net Sales
2,023.13
1,533.20
31.95%
Operating Profit (PBDIT) excl Other Income
151.34
77.23
95.96%
Interest
6.65
10.16
-34.55%
Exceptional Items
0.00
0.00
Consolidate Net Profit
94.35
41.44
127.68%
Operating Profit Margin (Excl OI)
7.48%
5.04%
2.44%
Values in Rs Cr.
Direction Arrows
Net Sales

YoY Growth in nine months ended Dec 2025 is 31.95% vs 30.03% in Dec 2024

Direction Arrows
Consolidated Net Profit

YoY Growth in nine months ended Dec 2025 is 127.68% vs 108.03% in Dec 2024

Annual Results Snapshot (Consolidated) - Mar'26stock-summary

Mar'26
Mar'25
Change(%)
Net Sales
2,958.36
2,056.91
43.83%
Operating Profit (PBDIT) excl Other Income
210.58
104.86
100.82%
Interest
10.39
12.18
-14.70%
Exceptional Items
-0.93
0.00
Consolidate Net Profit
131.87
58.05
127.17%
Operating Profit Margin (Excl OI)
7.12%
5.10%
2.02%
Values in Rs Cr.
Direction Arrows
Net Sales

YoY Growth in year ended Mar 2026 is 43.83% vs 33.42% in Mar 2025

Direction Arrows
Consolidated Net Profit

YoY Growth in year ended Mar 2026 is 127.17% vs 82.15% in Mar 2025

stock-summaryCompany CV
About Pondy Oxides & Chemicals Ltd stock-summary
stock-summary
Pondy Oxides & Chemicals Ltd
Small Cap
Non - Ferrous Metals
A Partnership Firm, Pondy Oxides & Chemicals Limited, got promoted by R D Bansal, Devekar Bansal and their Associates, in 1992. The Firm started its activities of trading of zinc and lead sub-oxide in Jul.'93. Later on, POC ventured into the manufacture of Zinc Oxide by putting up a manufacturing plant in Pondicherry. Pondy Oxides & Chemicals Limited(POCL) was incorporated in year 1995 to takeover the business of the partnership firm at a consideration of Rs.75 lacs.
Company Coordinates stock-summary
Company Details
KRM Centre 4th Floor, No 2 Harrington Road Chetpet Chennai Tamil Nadu : 600031
stock-summary
Tel: 91-044-42965454
stock-summary
kk@pocl.co.in
Registrar Details
Cameo Corporate Services Ltd , Subramanian Buildings No 1 , Club House Road, Chennai