PPAP Automotive

  • Market Cap: Micro Cap
  • Industry: Auto Components & Equipments
  • ISIN: INE095I01015
  • NSEID: PPAP
  • BSEID: 532934
INR
207.00
-0.05 (-0.02%)
BSENSE

Feb 11

BSE+NSE Vol: 3.71 k

  • Price Points
  • Score
  • Mojo Parameters
  • Total Return
  • News and Corporate Actions
  • Key factors
  • Shareholding
  • Financials
  • CompanyCV
stock-recommendationUpcoming Result: PPAP Automotive will declare its result soon on 13 Feb 2026
stock-summaryPrice Point
High/Low

1Day

52 Week

Valuation
Technical
Day's Volume

CASH

3.71 k (-72.08%) Volume

Shareholding (Dec 2025)

FII

5.70%

Held by 2 FIIs

DII

0.00%

Held by 0 DIIs

Promoter

64.48%

Who are in the management team of PPAP Automotive?

06-Jun-2025

As of March 2023, the management team of PPAP Automotive includes Ajay Kumar Jain (Chairman & Managing Director), Abhishek Jain (Managing Director & CEO), and several independent and non-executive directors. They oversee the company's operations and strategic direction.

As of March 2023, the management team of PPAP Automotive includes the following individuals:<BR><BR>1. Ajay Kumar Jain - Chairman & Managing Director<BR>2. Abhishek Jain - Managing Director & CEO<BR>3. Bhuwan Kumar Chaturvedi - Independent Director<BR>4. Pravin Gupta - Independent Director<BR>5. Vinay Kumari Jain - Non Executive Director<BR>6. Celine George - Non Executive Director<BR>7. Deepak Kumar Sethi - Independent Director<BR>8. Rohit Rajput - Additional Director<BR><BR>This team is responsible for overseeing the company's operations and strategic direction.

View full answer

Who are the peers of the PPAP Automotive?

03-Jun-2025

PPAP Automotive's peers include Samvardh. Mothe., Bosch, Schaeffler India, Bharat Forge, Tube Investments, Menon Pistons, Talbros Engg., Pritika Auto, LGB Forge, and Setco Automotive. In terms of management risk, growth, and capital structure, PPAP Automotive ranks average or below average compared to its peers.

Peers: The peers of PPAP Automotive are Samvardh. Mothe., Bosch, Schaeffler India, Bharat Forge, Tube Investments, Menon Pistons, Talbros Engg., Pritika Auto, LGB Forge, and Setco Automotive.<BR><BR>Quality Snapshot: Excellent management risk is observed at Schaeffler India, Tube Investments, and Menon Pistons, while Good management risk is found at Bosch, Bharat Forge, Talbros Engg., and Setco Automotive. Average management risk is noted for Samvardh. Mothe. and PPAP Automotive, whereas Below Average management risk is seen at Pritika Auto and LGB Forge. For growth, Excellent growth is exhibited by Samvardh. Mothe., Schaeffler India, and Tube Investments, while Good growth is found at Bharat Forge. Average growth is noted for Talbros Engg. and Pritika Auto, and Below Average growth is observed at PPAP Automotive, Menon Pistons, and LGB Forge. In terms of Capital Structure, Excellent capital structure is present at Bosch, Schaeffler India, and Tube Investments, while Good capital structure is seen at Bharat Forge and Menon Pistons. Average capital structure is noted for Talbros Engg., and Below Average capital structure is found at PPAP Automotive, Pritika Auto, and LGB Forge.<BR><BR>Return Snapshot: The peer with the highest 1-year return is Setco Automotive at 75.21%, while the peer with the lowest is Menon Pistons at -28.99%. PPAP Automotive's 1-year return of 28.70% is significantly higher than Menon Pistons but lower than Setco Automotive. Additionally, the peers with negative six-month returns include Samvardh. Mothe., Bosch, Tube Investments, Menon Pistons, and Pritika Auto.

View full answer

What is the technical trend for PPAP Automotive?

09-Jun-2025

As of June 2, 2025, PPAP Automotive's technical trend is mildly bullish, supported by bullish weekly MACD and Bollinger Bands, despite some caution from daily moving averages and a bearish monthly KST.

As of 2 June 2025, the technical trend for PPAP Automotive has changed from sideways to mildly bullish. The weekly MACD is bullish, supporting the positive sentiment, while the monthly MACD is mildly bullish. Bollinger Bands indicate a bullish stance on both weekly and monthly time frames. The Dow Theory also reflects a mildly bullish trend in both weekly and monthly assessments. However, daily moving averages are mildly bearish, which introduces some caution. The KST shows a mildly bullish weekly outlook but is bearish on the monthly scale. Overall, the current technical stance is mildly bullish, driven primarily by the bullish MACD and Bollinger Bands, alongside supportive Dow Theory indicators.

View full answer

What does PPAP Automotive do?

17-Jul-2025

PPAP Automotive Ltd manufactures profiles and plastic goods for the auto components industry, reporting net sales of 1,472 Cr and a net profit of 24 Cr for the quarter ending March 2025. The company operates in the Micro Cap segment with a market cap of INR 318 Cr.

Overview: <BR>PPAP Automotive Ltd is engaged in the manufacturing of profiles and plastic goods within the Auto Components & Equipments industry and operates in the Micro Cap market segment.<BR><BR>History: <BR>PPAP Automotive Ltd was originally incorporated on April 3rd, 1978, as a partnership firm. The company has undergone status changes since its inception, and the latest quarterly results report net sales and profit for the period ending March 2025.<BR><BR>Financial Snapshot: <BR>- Net Sales: 1,472 Cr (Quarterly Results - Mar 2025) <BR>- Net Profit: 24 Cr (Quarterly Results - Mar 2025) <BR>- Market cap: INR 318 Cr (Micro Cap) <BR><BR>Key Metrics: <BR>- P/E: 47.00 <BR>- Industry P/E: 39 <BR>- Dividend Yield: 0.97% <BR>- Debt Equity: 0.58 <BR>- Return on Equity: 2.43% <BR>- Price to Book: 1.11 <BR><BR>Contact Details: <BR>- Address: 54 Okhla Industrial Estate, Phase-III New Delhi New Delhi : 110020 <BR>- Tel: 91-11-26311671/26910777 <BR>- Email: investor@precisionpipes.com <BR>- Website: http://www.ppapco.in

View full answer

Who are the top shareholders of the PPAP Automotive?

17-Jul-2025

The top shareholders of PPAP Automotive include promoter Ajay Kumar Jain with 27.45%, followed by Foreign Institutional Investor Toacs Center Pte Limited at 5.67%, and individual investors holding 21.04%. There are no pledged promoter holdings or mutual funds involved.

The top shareholders of PPAP Automotive include the promoters, who hold the majority of the shares. The promoter with the highest holding is Ajay Kumar Jain, owning 27.45% of the company. Additionally, there is one Foreign Institutional Investor (FII) that holds 5.67% of the shares, which is also the highest public shareholder, Toacs Center Pte Limited. Individual investors collectively hold 21.04% of the shares. Notably, there are no pledged promoter holdings or mutual funds involved in this company.

View full answer

How big is PPAP Automotive?

24-Jul-2025

As of 24th July, PPAP Automotive Ltd has a market capitalization of 346.00 Cr, with recent net sales of 554.01 Cr and a net profit of 7.00 Cr. The company reported shareholder's funds of 282.89 Cr and total assets of 555.16 Cr for the annual period ending March 2024.

As of 24th July, PPAP Automotive Ltd has a market capitalization of 346.00 Cr, categorizing it as a Micro Cap company.<BR><BR>In the latest four quarters, PPAP Automotive reported Net Sales of 554.01 Cr and a Net Profit of 7.00 Cr.<BR><BR>For the latest annual period ending March 2024, the company had Shareholder's Funds of 282.89 Cr and Total Assets amounting to 555.16 Cr.

View full answer

Are PPAP Automotive latest results good or bad?

08-Aug-2025

PPAP Automotive's latest results are disappointing, with a Profit Before Tax of Rs -3.32 crore and a 15.8% decline in net sales to Rs 116.63 crore, marking the lowest sales in five quarters. Key metrics like operating profit margin and Earnings per Share have also worsened, indicating a challenging period for the company.

PPAP Automotive's latest financial results are disappointing. For the quarter ending June 2025, the company reported a Profit Before Tax (PBT) of Rs -3.32 crore, which is a significant decline of 275.9% compared to the previous average PBT. Similarly, the Profit After Tax (PAT) has fallen to Rs -2.27 crore, reflecting a decline of 229.7%.<BR><BR>Net sales also decreased to Rs 116.63 crore, down 15.8% from the average of the previous quarters, marking the lowest sales in the last five quarters. The operating profit margin has dropped to 7.97%, indicating reduced operational efficiency. Additionally, the Earnings per Share (EPS) has turned negative at Rs -1.61, which is concerning for shareholders.<BR><BR>The company's debt-equity ratio has increased to 0.61 times, suggesting a higher reliance on borrowing, which could affect liquidity. Overall, these results indicate a challenging period for PPAP Automotive, with significant declines across key performance metrics.

View full answer

Is PPAP Automotive overvalued or undervalued?

24-Sep-2025

As of September 23, 2025, PPAP Automotive is considered overvalued with a high PE ratio of 68.59 and an attractive valuation grade, despite a recent stock return of 12.2%, suggesting caution for potential investors.

As of 23 September 2025, the valuation grade for PPAP Automotive has moved from very attractive to attractive. The company is currently considered overvalued based on its high PE ratio of 68.59, which significantly exceeds the industry average. Additionally, the EV to EBITDA ratio stands at 8.89, and the PEG ratio is notably low at 0.47, indicating potential growth concerns relative to its price.<BR><BR>In comparison to its peers, Samvardhana Motherson has a PE ratio of 34.59 and an EV to EBITDA of 12.60, while Bosch is classified as expensive with a PE of 52.43 and an EV to EBITDA of 47.38. These comparisons highlight that PPAP Automotive's valuation metrics are on the higher end, suggesting it may be overvalued in the current market context. Despite a recent stock return of 12.2% over the past year, which outperformed the Sensex's decline of 2.97%, the overall valuation indicates caution for potential investors.

View full answer

When is the next results date for PPAP Automotive?

11-Nov-2025

PPAP Automotive will announce its results on 13 November 2025.

PPAP Automotive will declare its results on 13 November 2025.

View full answer

How has been the historical performance of PPAP Automotive?

13-Nov-2025

PPAP Automotive has shown a recovery in financial performance, with net sales increasing from 511.11 Cr in Mar'23 to 554.01 Cr in Mar'25, and a turnaround in profitability, achieving a profit after tax of 5.75 Cr in Mar'25 after previous losses. Total assets and cash flow from operations also improved, indicating enhanced operational efficiency.

Answer:<BR>The historical performance of PPAP Automotive shows a fluctuating trend in key financial metrics over the years, with a notable recovery in recent periods.<BR><BR>Breakdown:<BR>PPAP Automotive's net sales have shown a consistent upward trend, increasing from 511.11 Cr in Mar'23 to 554.01 Cr in Mar'25. Total operating income followed a similar pattern, rising from 511.11 Cr in Mar'23 to 554.01 Cr in Mar'25. However, the total expenditure, excluding depreciation, also increased from 467.17 Cr in Mar'23 to 496.83 Cr in Mar'25, reflecting rising costs, particularly in raw materials and employee costs. Operating profit (PBDIT) has seen fluctuations, with a peak of 58.49 Cr in Mar'25, up from 45.35 Cr in Mar'23. Profit before tax turned positive at 7.61 Cr in Mar'25 after a loss of 7.41 Cr in Mar'24, and profit after tax also improved to 5.75 Cr in Mar'25 from a loss of 12.40 Cr in Mar'24. The consolidated net profit showed a recovery to 7.00 Cr in Mar'25 from a loss of 13.04 Cr in Mar'24. The company's total assets increased to 567.58 Cr in Mar'25 from 555.73 Cr in Mar'24, while total liabilities also rose to 567.58 Cr in Mar'25 from 555.73 Cr in Mar'24. Cash flow from operating activities improved to 52.00 Cr in Mar'25, indicating better operational efficiency. Overall, while PPAP Automotive faced challenges in previous years, recent results indicate a positive turnaround in financial performance.

View full answer

Has PPAP Automotive declared dividend?

14-Nov-2025

PPAP Automotive Ltd has declared a 10% dividend with an ex-date of November 19, 2025, and a dividend yield of 1%. Total returns have varied, showing positive performance in the short term but some negative returns over longer periods.

PPAP Automotive Ltd has declared a 10% dividend.<BR><BR>Dividend Details:<BR>- Percentage announced: 10%<BR>- Ex-date: 19 Nov 25<BR><BR>Dividend Yield: 1%<BR><BR>Total Returns by Period:<BR>In the last 3 months, the price return was 11.74%, the dividend return was 1.10%, resulting in a total return of 12.84%.<BR><BR>Over the last 6 months, the price return was 32.61%, the dividend return was 1.25%, leading to a total return of 33.86%.<BR><BR>For the past year, the price return was 20.07%, the dividend return was 1.28%, culminating in a total return of 21.35%.<BR><BR>In the last 2 years, the price return was -7.76%, the dividend return was 1.98%, resulting in a total return of -5.78%.<BR><BR>Over the past 3 years, the price return was 23.77%, the dividend return was 2.42%, leading to a total return of 26.19%.<BR><BR>In the last 4 years, the price return was -3.07%, the dividend return was 3.34%, resulting in a total return of 0.27%.<BR><BR>For the past 5 years, the price return was -11.92%, the dividend return was 3.28%, culminating in a total return of -8.64%.<BR><BR>Overall, PPAP Automotive has declared a dividend and has shown varying total returns across different periods, with positive returns in the shorter terms and some negative returns over the longer term. The dividend yield of 1% indicates a modest return from dividends relative to the stock price.

View full answer

Should I buy, sell or hold PPAP Automotive Ltd?

20-Jan-2026

Why is PPAP Automotive Ltd falling/rising?

10-Feb-2026

As of 10-Feb, PPAP Automotive Ltd's stock price is at 208.20, reflecting a 2.94% increase. The stock has shown strong short-term performance, gaining 8.38% over the past week, although there is a decline in investor participation.

As of 10-Feb, PPAP Automotive Ltd's stock price is rising, currently at 208.20, which reflects an increase of 5.95 or 2.94%. This upward movement is supported by the stock's performance over the past week, where it has gained 8.38%, significantly outperforming the Sensex, which only increased by 0.64% during the same period. Additionally, the stock has been on a positive trend for the last three days, accumulating a total return of 7.85%. <BR><BR>Today's trading session saw the stock reach an intraday high of Rs 208.8, marking a rise of 3.24%. Furthermore, the stock is currently trading above its 5-day and 20-day moving averages, indicating short-term strength, although it remains below its longer-term moving averages (50-day, 100-day, and 200-day). <BR><BR>However, it is important to note that there has been a decline in investor participation, with delivery volume dropping by 14.92% compared to the 5-day average, which may suggest some caution among investors. Despite this, the stock remains liquid enough for trading, indicating that there is still interest in the stock. Overall, the combination of recent gains and positive short-term performance contributes to the current rise in PPAP Automotive Ltd's stock price.

View full answer
iScoreScore
Click here to find our call on this stock
Strong Sell
Sell
Hold
Buy
Strong Buy

Dashboard

1

Company's ability to service its debt is weak with a poor EBIT to Interest (avg) ratio of 1.69

  • Poor long term growth as Net Sales has grown by an annual rate of 13.80% over the last 5 years
  • Company's ability to service its debt is weak with a poor EBIT to Interest (avg) ratio of 1.69
  • The company has been able to generate a Return on Equity (avg) of 1.01% signifying low profitability per unit of shareholders funds
2

Flat results in Sep 25

stock-summaryMojo Parameters

Mojo Parameters

Loading Valuation Snapshot...

Stock DNA

stock-summary
Industry

Auto Components & Equipments

stock-summary
Market cap

INR 292 Cr (Micro Cap)

stock-summary
P/E

171.00

stock-summary
Industry P/E

39

stock-summary
Dividend Yield

1.20%

stock-summary
Debt Equity

0.61

stock-summary
Return on Equity

0.60%

stock-summary
Price to Book

1.03

Revenue and Profits:
Net Sales:
137 Cr
(Quarterly Results - Sep 2025)
Net Profit:
0 Cr
stock-summaryTotal Returns
Total Returns (Price + Dividend) stock-summary
Dividend Yield (1.2%)
TimePeriod
Price Return
Dividend Return
Total Return
3 Months
-18.82%
0.40%
-18.42%
6 Months
-9.96%
1.10%
-8.86%
1 Year
7.59%
1.40%
8.99%
2 Years
-13.77%
2.25%
-11.52%
3 Years
-1.31%
2.67%
1.36%
4 Years
-7.49%
3.72%
-3.77%
5 Years
-18.13%
3.73%
-14.4%

Latest dividend: 1 per share ex-dividend date: Nov-19-2025

Risk Adjusted Returns v/s stock-summary
Returns Beta
Icon
Beta has not been calculated since enough price history is not available
stock-summaryNews & Corporate Actions

News

Why is PPAP Automotive Ltd falling/rising?

Short-Term Price Movement and Sector Influence

PPAP Automotive Ltd’s recent price surge is underscored by its outperformance relative to the Auto Ancillary sector and the broader market. On the day in question, the stock outpaced its sector by 1.53%, while the Auto Ancillary sector itself gained 2.45%. This sectoral strength likely provided a supportive backdrop for the stock’s gains. Additionally, the stock has been on a positive trajectory for two consecutive days, accumulating a 4.71% return over this brief period. Intraday, the share price touched a high of ₹204.45, marking a 5.17% increase from previous levels, signalling robust buying interest during the session.

Despite this short-term rally, the stock remains positioned below its longer-term moving averages, in...

Read full news article
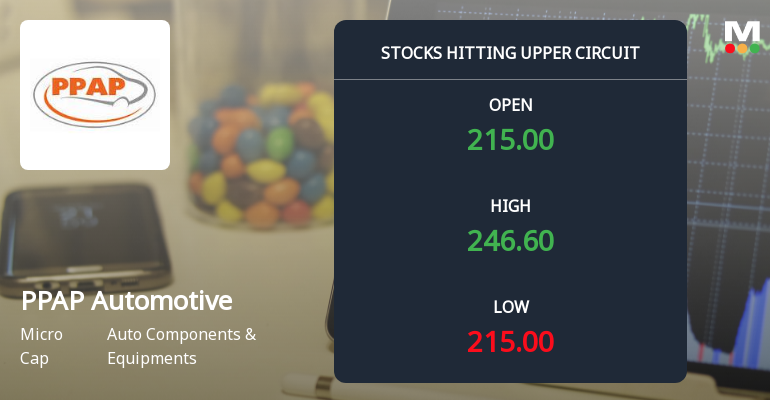
Announcements stock-summary

Board Meeting Intimation for Unaudited Financial Results For The Quarter And Nine Months Ended December 31 2025

09-Feb-2026 | Source : BSE

PPAP Automotive Ltdhas informed BSE that the meeting of the Board of Directors of the Company is scheduled on 13/02/2026 inter alia to consider and approve inter alia unaudited financial results for the quarter and nine months ended December 31 2025

Compliances-Certificate under Reg. 74 (5) of SEBI (DP) Regulations 2018

14-Jan-2026 | Source : BSE

Certificate under Regulation 74(5) of SEBI (Depositories and Participants) Regulations 2018

Announcement under Regulation 30 (LODR)-Diversification / Disinvestment

07-Jan-2026 | Source : BSE

PPAP has entered into settlement agreement with Tokai Kogyo Co. Ltd (Tokai) and PPAP Tokai India Rubber Private Limited (PTI) Joint Venture Company for sale of its shares 50% stake in PTI to Tokai.

Corporate Actions stock-summary

stock-summary
BOARD MEETING

13 Feb 2026

stock-summary
DIVIDEND

PPAP Automotive Ltd has declared 10% dividend, ex-date: 19 Nov 25

stock-summary
SPLITS

No Splits history available

stock-summary
BONUS

No Bonus history available

stock-summary
RIGHTS

No Rights history available

stock-summaryKey Factors

Quality key factors stock-summary

Factor
Value
Sales Growth (5y)
13.80%
EBIT Growth (5y)
63.00%
EBIT to Interest (avg)
1.69
Debt to EBITDA (avg)
3.05
Net Debt to Equity (avg)
0.61
Sales to Capital Employed (avg)
1.11
Tax Ratio
8.47%
Dividend Payout Ratio
50.33%
Pledged Shares
0
Institutional Holding
5.70%
ROCE (avg)
3.09%
ROE (avg)
1.01%

Valuation key factors

Factor
Value
P/E Ratio
171
Industry P/E
39
Price to Book Value
1.03
EV to EBIT
28.30
EV to EBITDA
9.18
EV to Capital Employed
1.02
EV to Sales
0.87
PEG Ratio
1.40
Dividend Yield
1.20%
ROCE (Latest)
3.60%
ROE (Latest)
0.60%

Technicals key factors

Indicator
Weekly
Monthly
MACD
Bearish
Mildly Bearish
RSI
No Signal
No Signal
Bollinger Bands
Mildly Bearish
Mildly Bearish
Moving Averages
Bearish (Daily)
KST
Bearish
Bullish
Dow Theory
Mildly Bearish
Mildly Bearish
OBV
Mildly Bearish
Mildly Bearish
stock-summary Technical Indicator Scale: Bearish, Mildly Bearish, Sideways, Mildly Bullish, Bullish  Turned 
stock-summaryShareholding
Shareholding Snapshot : Dec 2025stock-summary
Shareholding Compare (%holding) stock-summary
Majority shareholders

Promoters

Pledged Promoter Holdings

None

Mutual Funds

Held by 0 Schemes

FIIs

Held by 2 FIIs (5.7%)

Promoter with highest holding

Ajay Kumar Jain (27.4%)

Highest Public shareholder

Toacs Center Pte Limited (5.65%)

Individual Investors Holdings

20.84%

stock-summaryFinancial
[
  {
    "link": "quarterly",
    "btn_text": "All Quarterly Results",
    "header": "Quarterly Results Snapshot (Consolidated) - Sep'25 - QoQ",
    "rhs": [
      {
        "prefix": "Net Sales ",
        "suffix": "QoQ Growth in quarter ended Sep 2025 is 17.43% vs -20.78% in Jun 2025",
        "dir": 1
      },
      {
        "prefix": "Consolidated Net Profit ",
        "suffix": "QoQ Growth in quarter ended Sep 2025 is 97.80% vs -193.80% in Jun 2025",
        "dir": 1
      }
    ],
    "table": {
      "header": [
        "Sep'25",
        "Jun'25",
        "Change(%)"
      ],
      "body": [
        {
          "field": "Net Sales",
          "val1": "136.96",
          "val2": "116.63",
          "chgp": "17.43%",
          "chgp_class": "positive"
        },
        {
          "field": "Operating Profit (PBDIT) excl Other Income",
          "val1": "12.72",
          "val2": "9.30",
          "chgp": "36.77%",
          "chgp_class": "positive"
        },
        {
          "field": "Interest",
          "val1": "4.23",
          "val2": "4.26",
          "chgp": "-0.70%",
          "chgp_class": "positive"
        },
        {
          "field": "Exceptional Items",
          "val1": "0.00",
          "val2": "0.00",
          "chgp": "",
          "chgp_class": "neutral"
        },
        {
          "field": "Consolidate Net Profit",
          "val1": "-0.05",
          "val2": "-2.27",
          "chgp": "97.80%",
          "chgp_class": "positive"
        },
        {
          "field": "Operating Profit Margin (Excl OI)",
          "val1": "9.29%",
          "val2": "7.97%",
          "chgp": "1.32%",
          "chgp_class": "positive"
        }
      ]
    }
  },
  {
    "link": "half-yearly",
    "btn_text": "All Half Yearly Results",
    "header": "Half Yearly Results Snapshot (Consolidated) - Sep'25",
    "rhs": [
      {
        "prefix": "Net Sales ",
        "suffix": " Growth in half year ended Sep 2025 is -5.21% vs 1.02% in Sep 2024",
        "dir": -1
      },
      {
        "prefix": "Consolidated Net Profit ",
        "suffix": " Growth in half year ended Sep 2025 is -178.38% vs 233.94% in Sep 2024",
        "dir": -1
      }
    ],
    "table": {
      "header": [
        "Sep'25",
        "Sep'24",
        "Change(%)"
      ],
      "body": [
        {
          "field": "Net Sales",
          "val1": "253.59",
          "val2": "267.54",
          "chgp": "-5.21%",
          "chgp_class": "negative"
        },
        {
          "field": "Operating Profit (PBDIT) excl Other Income",
          "val1": "22.03",
          "val2": "28.19",
          "chgp": "-21.85%",
          "chgp_class": "negative"
        },
        {
          "field": "Interest",
          "val1": "8.50",
          "val2": "7.81",
          "chgp": "8.83%",
          "chgp_class": "negative"
        },
        {
          "field": "Exceptional Items",
          "val1": "0.00",
          "val2": "0.00",
          "chgp": "",
          "chgp_class": "neutral"
        },
        {
          "field": "Consolidate Net Profit",
          "val1": "-2.32",
          "val2": "2.96",
          "chgp": "-178.38%",
          "chgp_class": "negative"
        },
        {
          "field": "Operating Profit Margin (Excl OI)",
          "val1": "8.69%",
          "val2": "10.54%",
          "chgp": "-1.85%",
          "chgp_class": "negative"
        }
      ]
    }
  },
  {
    "link": "nine-monthly",
    "btn_text": "All Nine Monthly Results",
    "header": "Nine Monthly Results Snapshot (Consolidated) - Dec'24",
    "rhs": [
      {
        "prefix": "Net Sales ",
        "suffix": "YoY Growth in nine months ended Dec 2024 is 5.06% vs 2.21% in Dec 2023",
        "dir": 1
      },
      {
        "prefix": "Consolidated Net Profit ",
        "suffix": "YoY Growth in nine months ended Dec 2024 is 193.85% vs -32.97% in Dec 2023",
        "dir": 1
      }
    ],
    "table": {
      "header": [
        "Dec'24",
        "Dec'23",
        "Change(%)"
      ],
      "body": [
        {
          "field": "Net Sales",
          "val1": "406.79",
          "val2": "387.21",
          "chgp": "5.06%",
          "chgp_class": "positive"
        },
        {
          "field": "Operating Profit (PBDIT) excl Other Income",
          "val1": "42.18",
          "val2": "28.21",
          "chgp": "49.52%",
          "chgp_class": "positive"
        },
        {
          "field": "Interest",
          "val1": "12.06",
          "val2": "10.78",
          "chgp": "11.87%",
          "chgp_class": "negative"
        },
        {
          "field": "Exceptional Items",
          "val1": "0.00",
          "val2": "0.00",
          "chgp": "",
          "chgp_class": "neutral"
        },
        {
          "field": "Consolidate Net Profit",
          "val1": "4.58",
          "val2": "-4.88",
          "chgp": "193.85%",
          "chgp_class": "positive"
        },
        {
          "field": "Operating Profit Margin (Excl OI)",
          "val1": "10.37%",
          "val2": "7.29%",
          "chgp": "3.08%",
          "chgp_class": "positive"
        }
      ]
    }
  },
  {
    "link": "annual",
    "btn_text": "All Annual Results",
    "header": "Annual Results Snapshot (Consolidated) - Mar'25",
    "rhs": [
      {
        "prefix": "Net Sales ",
        "suffix": "YoY Growth in year ended Mar 2025 is 5.95% vs 2.31% in Mar 2024",
        "dir": 1
      },
      {
        "prefix": "Consolidated Net Profit ",
        "suffix": "YoY Growth in year ended Mar 2025 is 153.68% vs -119.53% in Mar 2024",
        "dir": 1
      }
    ],
    "table": {
      "header": [
        "Mar'25",
        "Mar'24",
        "Change(%)"
      ],
      "body": [
        {
          "field": "Net Sales",
          "val1": "554.01",
          "val2": "522.92",
          "chgp": "5.95%",
          "chgp_class": "positive"
        },
        {
          "field": "Operating Profit (PBDIT) excl Other Income",
          "val1": "57.18",
          "val2": "39.75",
          "chgp": "43.85%",
          "chgp_class": "positive"
        },
        {
          "field": "Interest",
          "val1": "16.42",
          "val2": "14.67",
          "chgp": "11.93%",
          "chgp_class": "negative"
        },
        {
          "field": "Exceptional Items",
          "val1": "0.00",
          "val2": "0.00",
          "chgp": "",
          "chgp_class": "neutral"
        },
        {
          "field": "Consolidate Net Profit",
          "val1": "7.00",
          "val2": "-13.04",
          "chgp": "153.68%",
          "chgp_class": "positive"
        },
        {
          "field": "Operating Profit Margin (Excl OI)",
          "val1": "10.32%",
          "val2": "7.60%",
          "chgp": "2.72%",
          "chgp_class": "positive"
        }
      ]
    }
  }
]

Quarterly Results Snapshot (Consolidated) - Sep'25 - QoQstock-summary

Sep'25
Jun'25
Change(%)
Net Sales
136.96
116.63
17.43%
Operating Profit (PBDIT) excl Other Income
12.72
9.30
36.77%
Interest
4.23
4.26
-0.70%
Exceptional Items
0.00
0.00
Consolidate Net Profit
-0.05
-2.27
97.80%
Operating Profit Margin (Excl OI)
9.29%
7.97%
1.32%
Values in Rs Cr.
Direction Arrows
Net Sales

QoQ Growth in quarter ended Sep 2025 is 17.43% vs -20.78% in Jun 2025

Direction Arrows
Consolidated Net Profit

QoQ Growth in quarter ended Sep 2025 is 97.80% vs -193.80% in Jun 2025

Half Yearly Results Snapshot (Consolidated) - Sep'25stock-summary

Sep'25
Sep'24
Change(%)
Net Sales
253.59
267.54
-5.21%
Operating Profit (PBDIT) excl Other Income
22.03
28.19
-21.85%
Interest
8.50
7.81
8.83%
Exceptional Items
0.00
0.00
Consolidate Net Profit
-2.32
2.96
-178.38%
Operating Profit Margin (Excl OI)
8.69%
10.54%
-1.85%
Values in Rs Cr.
Direction Arrows
Net Sales

Growth in half year ended Sep 2025 is -5.21% vs 1.02% in Sep 2024

Direction Arrows
Consolidated Net Profit

Growth in half year ended Sep 2025 is -178.38% vs 233.94% in Sep 2024

Nine Monthly Results Snapshot (Consolidated) - Dec'24stock-summary

Dec'24
Dec'23
Change(%)
Net Sales
406.79
387.21
5.06%
Operating Profit (PBDIT) excl Other Income
42.18
28.21
49.52%
Interest
12.06
10.78
11.87%
Exceptional Items
0.00
0.00
Consolidate Net Profit
4.58
-4.88
193.85%
Operating Profit Margin (Excl OI)
10.37%
7.29%
3.08%
Values in Rs Cr.
Direction Arrows
Net Sales

YoY Growth in nine months ended Dec 2024 is 5.06% vs 2.21% in Dec 2023

Direction Arrows
Consolidated Net Profit

YoY Growth in nine months ended Dec 2024 is 193.85% vs -32.97% in Dec 2023

Annual Results Snapshot (Consolidated) - Mar'25stock-summary

Mar'25
Mar'24
Change(%)
Net Sales
554.01
522.92
5.95%
Operating Profit (PBDIT) excl Other Income
57.18
39.75
43.85%
Interest
16.42
14.67
11.93%
Exceptional Items
0.00
0.00
Consolidate Net Profit
7.00
-13.04
153.68%
Operating Profit Margin (Excl OI)
10.32%
7.60%
2.72%
Values in Rs Cr.
Direction Arrows
Net Sales

YoY Growth in year ended Mar 2025 is 5.95% vs 2.31% in Mar 2024

Direction Arrows
Consolidated Net Profit

YoY Growth in year ended Mar 2025 is 153.68% vs -119.53% in Mar 2024

stock-summaryCompany CV
About PPAP Automotive Ltd stock-summary
stock-summary
PPAP Automotive Ltd
Micro Cap
Auto Components & Equipments
PPAP Automotive Ltd was originally incorporated on April 3rd, 1978 as a partnership firm by three partners viz. Devendra Chandra Jain (HUF), Ms Asha Jain and Ms Vinay Kumari Jain in the name and style of M/s Precision Pipes and Profiles Company, Delhi in carrying out business of manufacturing of profiles and plastic goods and other products.
Company Coordinates stock-summary
Company Details
54 Okhla Industrial Estate, Phase-III New Delhi New Delhi : 110020
stock-summary
Tel: 91-11-26311671/26910777
stock-summary
investor@precisionpipes.com
Registrar Details