Precision Camshf

  • Market Cap: Small Cap
  • Industry: Auto Components & Equipments
  • ISIN: INE484I01029
  • NSEID: PRECAM
  • BSEID: 539636
INR
160.24
-4.96 (-3.0%)
BSENSE

May 25

BSE+NSE Vol: 2.92 lacs

  • Price Points
  • Score
  • Mojo Parameters
  • Total Return
  • News and Corporate Actions
  • Key factors
  • Shareholding
  • Financials
  • CompanyCV
stock-summaryPrice Point
High/Low

1Day

52 Week

Valuation
Technical
Day's Volume

CASH

2.92 lacs (-35.47%) Volume

Shareholding (Mar 2026)

FII

0.13%

Held by 7 FIIs

DII

0.09%

Held by 0 DIIs

Promoter

65.37%

What does Precision Camshf do?

06-Jun-2025

Precision Camshafts Ltd is a small-cap company in the auto components industry, reporting net sales of ₹190 Cr and a net profit of ₹40 Cr for March 2025. It has a market cap of ₹2,160 Cr and key metrics include a P/E ratio of 78.00 and a dividend yield of 0.45%.

Overview:<BR>Precision Camshafts Ltd operates in the auto components and equipment industry and is categorized as a small-cap company.<BR><BR>History:<BR>The company was incorporated as Precision Camshafts Private Limited in 1992 and later converted to a public limited company in 1997. The most recent quarterly results reported net sales and net profit for March 2025.<BR><BR>Financial Snapshot:<BR>- Net Sales: 190 Cr (Quarterly Results - Mar 2025)<BR>- Net Profit: 40 Cr (Quarterly Results - Mar 2025)<BR>- Market Cap: Rs 2,160 Cr (Small Cap)<BR><BR>Key Metrics:<BR>- P/E: 78.00<BR>- Industry P/E: 36<BR>- Dividend Yield: 0.45%<BR>- Debt Equity: -0.37<BR>- Return on Equity: 3.43%<BR>- Price to Book: 2.68<BR><BR>Contact Details:<BR>Address: E-102/103 E-90 And W-39, M I D C Akkalkot Road Solapur Maharashtra : 413006<BR>Tel: 91-91686465/31/32/33 36/37<BR>Email: info@pclindia.in/cs@pclindia.in<BR>Website: http://www.pclindia.in

View full answer

Who are in the management team of Precision Camshf?

06-Jun-2025

As of March 2023, the management team of Precision Camshf includes Yatin Shah (Chairman & Managing Director), Ravindra R Joshi (Whole Time Director & CFO), and several directors, both executive and independent, overseeing the company's operations and strategy.

As of March 2023, the management team of Precision Camshf includes the following individuals:<BR><BR>1. Yatin Shah - Chairman & Managing Director<BR>2. Suhasini Y Shah - Non-Executive & Non-Independent Director<BR>3. Ravindra R Joshi - Whole Time Director & CFO<BR>4. Karan Y Shah - Director (Business Development)<BR>5. Savani Arvind Laddha - Non-Executive & Independent Director<BR>6. Gautam V. Wakankar - Company Secretary & Compliance Officer<BR>7. Ameet N. Dravid - Independent Director<BR>8. Apurva Pradeep Joshi - Independent Director<BR>9. Anagha Srinivas Rao Anasingaraju - Independent Director<BR>10. Suhas J. Ahirrao - Independent Director<BR><BR>This team is responsible for overseeing the company's operations and strategic direction.

View full answer

Has Precision Camshf declared dividend?

06-Jun-2025

Precision Camshafts Ltd has declared a 10% dividend, amounting to 1 per share, with an ex-date of July 19, 2024. While recent returns have shown volatility, long-term performance over five years indicates substantial growth, with a total return of 748.58%.

Precision Camshafts Ltd has declared a 10% dividend.<BR><BR>Dividend Details:<BR>- Percentage announced: 10%<BR>- Amount per share: 1 per share<BR>- Ex-date: 19 Jul 24<BR><BR>Dividend Yield: 0.45%.<BR><BR>Total Returns by Period:<BR>In the last 6 months, the price return was -29.69%, with a dividend return of 0%, resulting in a total return of -29.69%.<BR><BR>Over the past year, the price return was 23.36%, the dividend return was 0.51%, leading to a total return of 23.87%.<BR><BR>In the 2-year period, the price return stood at 36.15%, with a dividend return of 1.02%, culminating in a total return of 37.17%.<BR><BR>For the 3-year period, the price return was 119.44%, the dividend return was 3.45%, resulting in a total return of 122.89%.<BR><BR>In the last 4 years, the price return reached 329.84%, with a dividend return of 5.25%, leading to a total return of 335.09%.<BR><BR>Over the 5-year period, the price return was 733.94%, the dividend return was 14.64%, resulting in a total return of 748.58%.<BR><BR>Overall, Precision Camshafts Ltd has declared a dividend, and while the recent returns show some volatility, particularly in the short term, the long-term returns indicate significant growth, especially over the last five years.

View full answer

Who are the peers of the Precision Camshf?

03-Jun-2025

Precision Camshf's peers include Samvardh. Mothe., Bosch, Schaeffler India, Bharat Forge, Tube Investments, Talbros Auto., Wheels India, Divgi Torq, MM Forgings, and India Nipp.Elec. Precision Camshf has an average management risk and a below-average growth rating, with the highest 1-year return among peers at 10.19%.

Peers: The peers of Precision Camshf are Samvardh. Mothe., Bosch, Schaeffler India, Bharat Forge, Tube Investments, Talbros Auto., Wheels India, Divgi Torq, MM Forgings, and India Nipp.Elec.<BR><BR>Quality Snapshot: Excellent management risk is observed at Bosch, Schaeffler India, Bharat Forge, Tube Investments, and Talbros Auto., while Average management risk is found at Precision Camshf, Samvardh. Mothe., Wheels India, Divgi Torq, MM Forgings, and India Nipp.Elec. Growth is Excellent for Schaeffler India and Tube Investments, Good for Bharat Forge and Talbros Auto., Average for Bosch, and Below Average for Precision Camshf, Samvardh. Mothe., Wheels India, Divgi Torq, MM Forgings, and India Nipp.Elec. Capital Structure is Excellent for Bosch, Schaeffler India, and Tube Investments, Good for Precision Camshf, Talbros Auto., and Average for Bharat Forge, while the rest have Below Average ratings.<BR><BR>Return Snapshot: The peer with the highest 1-year return is Precision Camshf at 10.19%, while the lowest is MM Forgings at -38.50%. Precision Camshf's return is significantly higher than that of MM Forgings. Additionally, the six-month returns are negative for Samvardh. Mothe., Bosch, Tube Investments, Bharat Forge, Divgi Torq, MM Forgings, and India Nipp.Elec.

View full answer

Who are the top shareholders of the Precision Camshf?

17-Jul-2025

The top shareholders of Precision Camshf include Yatin Subhash Shah with 39.78%, Jayant Aradhye with 8.51%, and individual investors holding 29.17%. Additionally, 18 foreign institutional investors hold a combined 0.4%, with no mutual funds currently invested.

The top shareholders of Precision Camshf include the promoters, with Yatin Subhash Shah holding the largest stake at 39.78%. Additionally, the highest public shareholder is Jayant Aradhye, who owns 8.51%. Individual investors collectively hold 29.17% of the shares. There are also 18 foreign institutional investors (FIIs) with a combined holding of 0.4%, but no mutual funds are currently invested in the company.

View full answer

How big is Precision Camshf?

24-Jul-2025

As of 24th July, Precision Camshafts Ltd has a market capitalization of 1,863.00 Cr, with recent net sales of 865.37 Cr and a net profit of 54.10 Cr. The latest balance sheet shows shareholder's funds of 792.50 Cr and total assets of 1,076.83 Cr.

As of 24th July, Precision Camshafts Ltd has a market capitalization of 1,863.00 Cr, categorizing it as a Small Cap company.<BR><BR>For the latest four quarters, the company reported Net Sales of 865.37 Cr and a Net Profit of 54.10 Cr.<BR><BR>The latest annual period for the balance sheet is March 2025, showing Shareholder's Funds of 792.50 Cr and Total Assets of 1,076.83 Cr.

View full answer

Is Precision Camshf overvalued or undervalued?

13-Nov-2025

As of November 12, 2025, Precision Camshf is considered overvalued with a PE ratio of 52.46, significantly higher than its peers, and has underperformed the Sensex with a year-to-date return of -50.18%.

As of 12 November 2025, the valuation grade for Precision Camshf has moved from very expensive to expensive. The company is currently considered overvalued based on its high valuation metrics. The PE ratio stands at 52.46, while the EV to EBITDA ratio is 21.71, and the Price to Book Value is 2.08, indicating significant premium pricing relative to its earnings and book value.<BR><BR>In comparison to its peers, Precision Camshf's PE ratio is notably higher than Samvardhan Motherson, which has a PE of 32.72 and is rated attractive, and Bosch, which has a PE of 48.27 and is rated fair. This suggests that Precision Camshf is not only overvalued relative to its immediate competitors but also has a concerning PEG ratio of 0.00, indicating a lack of growth relative to its price. Additionally, the stock has underperformed against the Sensex, with a year-to-date return of -50.18% compared to the Sensex's positive return of 8.10%.

View full answer

How has been the historical performance of Precision Camshf?

24-Nov-2025

Precision Camshf's historical performance shows declining net sales and operating profit from March 2023 to March 2025, but improvements in profit before tax, profit after tax, earnings per share, and cash flow from operating activities indicate enhanced profitability and cash generation. Total assets and liabilities have also slightly increased during this period.

Answer:<BR>The historical performance of Precision Camshf shows a fluctuating trend in key financial metrics over the years.<BR><BR>Breakdown:<BR>Precision Camshf's net sales have seen a decline from INR 1,080.14 crore in March 2023 to INR 865.36 crore in March 2025, reflecting a downward trend. Total operating income followed a similar pattern, decreasing from INR 1,080.14 crore in March 2023 to INR 865.36 crore in March 2025. The total expenditure, excluding depreciation, also decreased from INR 969.53 crore in March 2023 to INR 784.48 crore in March 2025. Operating profit, which peaked at INR 143.74 crore in March 2023, fell to INR 113.73 crore by March 2025. Profit before tax improved from INR 60.28 crore in March 2023 to INR 83.13 crore in March 2025, while profit after tax increased from INR 46.29 crore to INR 54.11 crore in the same period. The earnings per share (EPS) rose from INR 4.87 in March 2023 to INR 5.7 in March 2025. On the balance sheet, total assets increased from INR 1,101.38 crore in March 2023 to INR 1,076.83 crore in March 2025, while total liabilities also saw a slight increase from INR 1,035.69 crore to INR 1,076.83 crore. Cash flow from operating activities improved from INR 103 crore in March 2023 to INR 143 crore in March 2025, indicating a positive trend in cash generation. Overall, while sales and operating profit have declined, the company has managed to enhance its profitability and cash flow in recent years.

View full answer

Is Precision Camshf technically bullish or bearish?

05-Dec-2025

As of December 4, 2025, Precision Camshf has a strong bearish outlook, supported by bearish MACD, Bollinger Bands, and moving averages across weekly and monthly charts.

As of 4 December 2025, the technical trend for Precision Camshf has changed from mildly bearish to bearish. The current stance is bearish with strong indicators supporting this view. Both the weekly and monthly MACD are bearish, and Bollinger Bands also indicate a bearish trend across these time frames. Daily moving averages confirm the bearish sentiment. The KST is bearish on both weekly and monthly charts, while the Dow Theory reflects a mildly bearish stance on the weekly and monthly levels. Overall, the technical indicators suggest a strong bearish outlook for Precision Camshf.

View full answer

When is the next results date for Precision Camshafts Ltd?

19-May-2026

The next results date for Precision Camshafts Ltd is 22 May 2026.

The next results date for Precision Camshafts Ltd is scheduled for 22 May 2026.

View full answer

Are Precision Camshafts Ltd latest results good or bad?

23-May-2026

Precision Camshafts Ltd's latest results are concerning, showing a 75.12% decline in net profit despite record quarterly revenue growth. The significant drop in profitability and weak margins suggest structural challenges, leading to a negative outlook for the company.

Precision Camshafts Ltd's latest results indicate a troubling performance, particularly in terms of profitability. While the company achieved record quarterly revenue of ₹201.01 crores for Q4 FY26, reflecting a 5.56% year-on-year growth and a 12.50% sequential increase, this was overshadowed by a significant decline in net profit. The net profit for the same quarter fell dramatically by 75.12% year-on-year to ₹10.06 crores, highlighting serious challenges in translating revenue growth into sustainable profitability.<BR><BR>Moreover, the company's operating margin decreased slightly to 13.10%, and the profit after tax (PAT) margin collapsed to 5.00% from 21.24% a year prior, indicating operational difficulties. The high effective tax rate of 54.15% also contributed to the profit decline, raising concerns about the company's tax management.<BR><BR>In terms of overall performance, Precision Camshafts has underperformed its sector, with a stock price decline of 2.74% over the past year compared to a 17.68% gain in the broader auto components sector. This underperformance, combined with weak return metrics (ROE of 3.96% and ROCE of 2.07%), suggests that the company is facing structural challenges that may hinder its growth prospects.<BR><BR>In summary, while the revenue growth is a positive sign, the drastic drop in profitability and the company's inability to maintain healthy margins paint a concerning picture for investors. The overall assessment leans towards a negative outlook, indicating that the latest results are more bad than good.

View full answer

Should I buy, sell or hold Precision Camshafts Ltd?

23-May-2026

Why is Precision Camshafts Ltd falling/rising?

25-May-2026

As of 24-May, Precision Camshafts Ltd's stock price is 165.35, down 0.18%, following a trend reversal after three days of gains. Despite a recent weekly increase of 6.37%, the stock has underperformed year-to-date and over the past year, with rising investor interest but concerns over its high valuation and consistent underperformance against benchmarks.

As of 24-May, Precision Camshafts Ltd's stock price is currently at 165.35, reflecting a decrease of 0.3, or 0.18%. The stock has recently experienced a trend reversal, having fallen after three consecutive days of gains. This decline is notable as the stock has underperformed its sector by 1.09% today.<BR><BR>Despite a positive performance over the past week, where the stock increased by 6.37% compared to a mere 0.24% increase in the Sensex, it has shown a year-to-date decline of 0.78%. The stock's performance over the last year has also been negative, with a return of -2.74%, while the broader market has similarly struggled, showing a decline of 6.84%.<BR><BR>Investor participation has seen a significant rise, with delivery volume increasing by 529.11% against the 5-day average, indicating heightened interest. However, the stock's valuation appears expensive, with a Price to Book Value of 1.9 and a low return on equity (ROE) of 4. This premium valuation compared to peers may deter some investors, especially given that domestic mutual funds hold no stake in the company, which could suggest a lack of confidence at current price levels.<BR><BR>Furthermore, while the company is net-debt free and has reported impressive growth in operating profit and net sales, the consistent underperformance against benchmarks over the last three years raises concerns. The stock's PEG ratio of 0.1, despite profit increases, indicates that the market may not fully value these gains, contributing to the current downward pressure on the stock price.

View full answer
iScoreScore
Click here to find our call on this stock
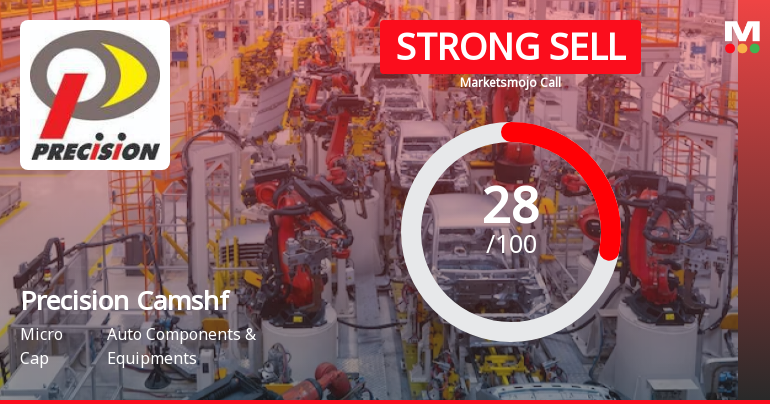
Strong Sell
Sell
Hold
Buy
Strong Buy

Dashboard

1

With ROE of 4, it has a Expensive valuation with a 1.9 Price to Book Value

  • The stock is trading at a premium compared to its peers' average historical valuations
  • Over the past year, while the stock has generated a return of -7.37%, its profits have risen by 219.2% ; the PEG ratio of the company is 0.1
2

Despite the size of the company, domestic mutual funds hold only 0% of the company

3

Consistent Underperformance against the benchmark over the last 3 years

stock-summaryMojo Parameters

Mojo Parameters

Loading Valuation Snapshot...

Stock DNA

stock-summary
Industry

Auto Components & Equipments

stock-summary
Market cap

INR 1,522 Cr (Small Cap)

stock-summary
P/E

31.00

stock-summary
Industry P/E

36

stock-summary
Dividend Yield

0.61%

stock-summary
Debt Equity

-0.44

stock-summary
Return on Equity

3.96%

stock-summary
Price to Book

1.91

Revenue and Profits:
Net Sales:
201 Cr
(Quarterly Results - Mar 2026)
Net Profit:
10 Cr
stock-summaryTotal Returns
Total Returns (Price + Dividend) stock-summary
Dividend Yield (0.61%)
TimePeriod
Price Return
Dividend Return
Total Return
3 Months
16.08%
0%
16.08%
6 Months
-7.74%
0%
-7.74%
1 Year
-7.52%
0.52%
-7.0%
2 Years
-15.66%
1.11%
-14.55%
3 Years
-3.27%
1.75%
-1.52%
4 Years
60.96%
4.21%
65.17%
5 Years
168.41%
7.62%
176.03%

Latest dividend: 1 per share ex-dividend date: Jul-23-2025

Risk Adjusted Returns v/s stock-summary
Returns Beta
Icon
Beta has not been calculated since enough price history is not available
stock-summaryNews & Corporate Actions

News

Precision Camshafts Ltd Gains 6.37%: Valuation Shifts and Intraday Surge Define Week

Announcements stock-summary

Precision Camshafts Limited - Updates

09-Dec-2019 | Source : NSE

Precision Camshafts Limited has informed the Exchange regarding 'Submission of Disclosure under Regulation 7(2) read with Regulation 6(2) of Securities Exchange Board of India (Prohibition of Insider Trading) Regulations 2015'.

Precision Camshafts Limited - Updates

03-Dec-2019 | Source : NSE

Precision Camshafts Limited has informed the Exchange regarding 'Submission of Disclosure under Regulation 29(1) of SEBI (Substantial Acquisition of Shares and Takeovers) Regulations, 2011'.

Precision Camshafts Limited - Analysts/Institutional Investor Meet/Con. Call Updates

28-Nov-2019 | Source : NSE

Precision Camshafts Limited has informed the Exchange regarding Analysts/Institutional Investor Meet/Con. Call Updates

Corporate Actions stock-summary

stock-summary
BOARD MEETING

No Upcoming Board Meetings

stock-summary
DIVIDEND

Precision Camshafts Ltd has declared 10% dividend, ex-date: 23 Jul 25

stock-summary
SPLITS

No Splits history available

stock-summary
BONUS

No Bonus history available

stock-summary
RIGHTS

No Rights history available

stock-summaryKey Factors

Quality key factors stock-summary

Factor
Value
Sales Growth (5y)
2.63%
EBIT Growth (5y)
40.89%
EBIT to Interest (avg)
2.40
Debt to EBITDA (avg)
1.34
Net Debt to Equity (avg)
-0.44
Sales to Capital Employed (avg)
1.11
Tax Ratio
25.59%
Dividend Payout Ratio
23.54%
Pledged Shares
0
Institutional Holding
0.22%
ROCE (avg)
3.32%
ROE (avg)
3.95%

Valuation key factors

Factor
Value
P/E Ratio
31
Industry P/E
36
Price to Book Value
1.91
EV to EBIT
64.03
EV to EBITDA
17.72
EV to Capital Employed
2.63
EV to Sales
1.57
PEG Ratio
0.14
Dividend Yield
0.61%
ROCE (Latest)
2.07%
ROE (Latest)
3.96%

Technicals key factors

Indicator
Weekly
Monthly
MACD
Mildly Bullish
Bearish
RSI
No Signal
No Signal
Bollinger Bands
Bullish
Mildly Bearish
Moving Averages
Mildly Bearish (Daily)
KST
Mildly Bullish
Bearish
Dow Theory
No Trend
Mildly Bullish
OBV
Bullish
Bullish
stock-summary Technical Indicator Scale: Bearish, Mildly Bearish, Sideways, Mildly Bullish, Bullish  Turned 
stock-summaryShareholding
Shareholding Snapshot : Mar 2026stock-summary
Shareholding Compare (%holding) stock-summary
Majority shareholders

Promoters

Pledged Promoter Holdings

None

Mutual Funds

Held by 0 Schemes

FIIs

Held by 7 FIIs (0.13%)

Promoter with highest holding

Yatin Subhash Shah (39.78%)

Highest Public shareholder

Jayant Aradhye (8.4%)

Individual Investors Holdings

29.92%

stock-summaryFinancial
[
  {
    "link": "quarterly",
    "btn_text": "All Quarterly Results",
    "header": "Quarterly Results Snapshot (Consolidated) - Mar'26 - QoQ",
    "rhs": [
      {
        "prefix": "Net Sales ",
        "suffix": "QoQ Growth in quarter ended Mar 2026 is 12.50% vs -9.84% in Dec 2025",
        "dir": 1
      },
      {
        "prefix": "Consolidated Net Profit ",
        "suffix": "QoQ Growth in quarter ended Mar 2026 is 9.23% vs -30.02% in Dec 2025",
        "dir": 1
      }
    ],
    "table": {
      "header": [
        "Mar'26",
        "Dec'25",
        "Change(%)"
      ],
      "body": [
        {
          "field": "Net Sales",
          "val1": "201.01",
          "val2": "178.68",
          "chgp": "12.50%",
          "chgp_class": "positive"
        },
        {
          "field": "Operating Profit (PBDIT) excl Other Income",
          "val1": "26.34",
          "val2": "14.41",
          "chgp": "82.79%",
          "chgp_class": "positive"
        },
        {
          "field": "Interest",
          "val1": "1.74",
          "val2": "1.23",
          "chgp": "41.46%",
          "chgp_class": "negative"
        },
        {
          "field": "Exceptional Items",
          "val1": "2.62",
          "val2": "-1.55",
          "chgp": "269.03%",
          "chgp_class": "positive"
        },
        {
          "field": "Consolidate Net Profit",
          "val1": "10.06",
          "val2": "9.21",
          "chgp": "9.23%",
          "chgp_class": "positive"
        },
        {
          "field": "Operating Profit Margin (Excl OI)",
          "val1": "13.10%",
          "val2": "8.06%",
          "chgp": "5.04%",
          "chgp_class": "positive"
        }
      ]
    }
  },
  {
    "link": "half-yearly",
    "btn_text": "All Half Yearly Results",
    "header": "Half Yearly Results Snapshot (Consolidated) - Sep'25",
    "rhs": [
      {
        "prefix": "Net Sales ",
        "suffix": " Growth in half year ended Sep 2025 is -18.15% vs -7.12% in Sep 2024",
        "dir": -1
      },
      {
        "prefix": "Consolidated Net Profit ",
        "suffix": " Growth in half year ended Sep 2025 is 59.74% vs 59.65% in Sep 2024",
        "dir": 1
      }
    ],
    "table": {
      "header": [
        "Sep'25",
        "Sep'24",
        "Change(%)"
      ],
      "body": [
        {
          "field": "Net Sales",
          "val1": "393.19",
          "val2": "480.39",
          "chgp": "-18.15%",
          "chgp_class": "negative"
        },
        {
          "field": "Operating Profit (PBDIT) excl Other Income",
          "val1": "27.70",
          "val2": "47.08",
          "chgp": "-41.16%",
          "chgp_class": "negative"
        },
        {
          "field": "Interest",
          "val1": "3.85",
          "val2": "3.70",
          "chgp": "4.05%",
          "chgp_class": "negative"
        },
        {
          "field": "Exceptional Items",
          "val1": "9.50",
          "val2": "0.00",
          "chgp": "",
          "chgp_class": "neutral"
        },
        {
          "field": "Consolidate Net Profit",
          "val1": "31.98",
          "val2": "20.02",
          "chgp": "59.74%",
          "chgp_class": "positive"
        },
        {
          "field": "Operating Profit Margin (Excl OI)",
          "val1": "7.04%",
          "val2": "9.80%",
          "chgp": "-2.76%",
          "chgp_class": "negative"
        }
      ]
    }
  },
  {
    "link": "nine-monthly",
    "btn_text": "All Nine Monthly Results",
    "header": "Nine Monthly Results Snapshot (Consolidated) - Dec'25",
    "rhs": [
      {
        "prefix": "Net Sales ",
        "suffix": "YoY Growth in nine months ended Dec 2025 is -15.27% vs -12.90% in Dec 2024",
        "dir": -1
      },
      {
        "prefix": "Consolidated Net Profit ",
        "suffix": "YoY Growth in nine months ended Dec 2025 is 201.54% vs -63.08% in Dec 2024",
        "dir": 1
      }
    ],
    "table": {
      "header": [
        "Dec'25",
        "Dec'24",
        "Change(%)"
      ],
      "body": [
        {
          "field": "Net Sales",
          "val1": "571.87",
          "val2": "674.94",
          "chgp": "-15.27%",
          "chgp_class": "negative"
        },
        {
          "field": "Operating Profit (PBDIT) excl Other Income",
          "val1": "42.11",
          "val2": "55.24",
          "chgp": "-23.77%",
          "chgp_class": "negative"
        },
        {
          "field": "Interest",
          "val1": "5.08",
          "val2": "5.23",
          "chgp": "-2.87%",
          "chgp_class": "positive"
        },
        {
          "field": "Exceptional Items",
          "val1": "7.95",
          "val2": "1.23",
          "chgp": "546.34%",
          "chgp_class": "positive"
        },
        {
          "field": "Consolidate Net Profit",
          "val1": "41.19",
          "val2": "13.66",
          "chgp": "201.54%",
          "chgp_class": "positive"
        },
        {
          "field": "Operating Profit Margin (Excl OI)",
          "val1": "7.36%",
          "val2": "8.18%",
          "chgp": "-0.82%",
          "chgp_class": "negative"
        }
      ]
    }
  },
  {
    "link": "annual",
    "btn_text": "All Annual Results",
    "header": "Annual Results Snapshot (Consolidated) - Mar'26",
    "rhs": [
      {
        "prefix": "Net Sales ",
        "suffix": "YoY Growth in year ended Mar 2026 is -10.69% vs -16.08% in Mar 2025",
        "dir": 1
      },
      {
        "prefix": "Consolidated Net Profit ",
        "suffix": "YoY Growth in year ended Mar 2026 is -5.29% vs 34.10% in Mar 2025",
        "dir": -1
      }
    ],
    "table": {
      "header": [
        "Mar'26",
        "Mar'25",
        "Change(%)"
      ],
      "body": [
        {
          "field": "Net Sales",
          "val1": "772.88",
          "val2": "865.36",
          "chgp": "-10.69%",
          "chgp_class": "negative"
        },
        {
          "field": "Operating Profit (PBDIT) excl Other Income",
          "val1": "68.45",
          "val2": "80.88",
          "chgp": "-15.37%",
          "chgp_class": "negative"
        },
        {
          "field": "Interest",
          "val1": "6.81",
          "val2": "8.17",
          "chgp": "-16.65%",
          "chgp_class": "positive"
        },
        {
          "field": "Exceptional Items",
          "val1": "10.57",
          "val2": "34.93",
          "chgp": "-69.74%",
          "chgp_class": "negative"
        },
        {
          "field": "Consolidate Net Profit",
          "val1": "51.25",
          "val2": "54.11",
          "chgp": "-5.29%",
          "chgp_class": "negative"
        },
        {
          "field": "Operating Profit Margin (Excl OI)",
          "val1": "8.86%",
          "val2": "9.35%",
          "chgp": "-0.49%",
          "chgp_class": "negative"
        }
      ]
    }
  }
]

Quarterly Results Snapshot (Consolidated) - Mar'26 - QoQstock-summary

Mar'26
Dec'25
Change(%)
Net Sales
201.01
178.68
12.50%
Operating Profit (PBDIT) excl Other Income
26.34
14.41
82.79%
Interest
1.74
1.23
41.46%
Exceptional Items
2.62
-1.55
269.03%
Consolidate Net Profit
10.06
9.21
9.23%
Operating Profit Margin (Excl OI)
13.10%
8.06%
5.04%
Values in Rs Cr.
Direction Arrows
Net Sales

QoQ Growth in quarter ended Mar 2026 is 12.50% vs -9.84% in Dec 2025

Direction Arrows
Consolidated Net Profit

QoQ Growth in quarter ended Mar 2026 is 9.23% vs -30.02% in Dec 2025

Half Yearly Results Snapshot (Consolidated) - Sep'25stock-summary

Sep'25
Sep'24
Change(%)
Net Sales
393.19
480.39
-18.15%
Operating Profit (PBDIT) excl Other Income
27.70
47.08
-41.16%
Interest
3.85
3.70
4.05%
Exceptional Items
9.50
0.00
Consolidate Net Profit
31.98
20.02
59.74%
Operating Profit Margin (Excl OI)
7.04%
9.80%
-2.76%
Values in Rs Cr.
Direction Arrows
Net Sales

Growth in half year ended Sep 2025 is -18.15% vs -7.12% in Sep 2024

Direction Arrows
Consolidated Net Profit

Growth in half year ended Sep 2025 is 59.74% vs 59.65% in Sep 2024

Nine Monthly Results Snapshot (Consolidated) - Dec'25stock-summary

Dec'25
Dec'24
Change(%)
Net Sales
571.87
674.94
-15.27%
Operating Profit (PBDIT) excl Other Income
42.11
55.24
-23.77%
Interest
5.08
5.23
-2.87%
Exceptional Items
7.95
1.23
546.34%
Consolidate Net Profit
41.19
13.66
201.54%
Operating Profit Margin (Excl OI)
7.36%
8.18%
-0.82%
Values in Rs Cr.
Direction Arrows
Net Sales

YoY Growth in nine months ended Dec 2025 is -15.27% vs -12.90% in Dec 2024

Direction Arrows
Consolidated Net Profit

YoY Growth in nine months ended Dec 2025 is 201.54% vs -63.08% in Dec 2024

Annual Results Snapshot (Consolidated) - Mar'26stock-summary

Mar'26
Mar'25
Change(%)
Net Sales
772.88
865.36
-10.69%
Operating Profit (PBDIT) excl Other Income
68.45
80.88
-15.37%
Interest
6.81
8.17
-16.65%
Exceptional Items
10.57
34.93
-69.74%
Consolidate Net Profit
51.25
54.11
-5.29%
Operating Profit Margin (Excl OI)
8.86%
9.35%
-0.49%
Values in Rs Cr.
Direction Arrows
Net Sales

YoY Growth in year ended Mar 2026 is -10.69% vs -16.08% in Mar 2025

Direction Arrows
Consolidated Net Profit

YoY Growth in year ended Mar 2026 is -5.29% vs 34.10% in Mar 2025

stock-summaryCompany CV
About Precision Camshafts Ltd stock-summary
stock-summary
Precision Camshafts Ltd
Small Cap
Auto Components & Equipments
Precision Camshafts Limited was incorporated as `Precision Camshafts Private Limited' on June 8, 1992 with Registrar of Companies, Maharashtra at Mumbai. Pursuant to conversion of Company into a Public Limited Company, the name was changed to `Precision Camshafts Limited' and a fresh Certificate of Incorporation was issued by the Registrar of Companies, Mumbai on August 1, 1997.
Company Coordinates stock-summary
Company Details
E-102/103 E-90 And W-39, M I D C Akkalkot Road Solapur Maharashtra : 413006
stock-summary
Tel: 91-91686465/31/32/33 36/37
stock-summary
info@pclindia.in/cs@pclindia.in
Registrar Details
Link Intime India Pvt Ltd, Block No 202, 2nd Floor, Akshay Complex, Near Ganesh Temple, Off Dhole Patil Road , Pune