
Compare Premier Polyfilm with Similar Stocks
Dashboard
Company has a Debt to Equity ratio (avg) of 0.01 times
Poor long term growth as Net Sales has grown by an annual rate of 14.41% over the last 5 years
Flat results in Mar 26
With ROE of 21.7, it has a Very Attractive valuation with a 4 Price to Book Value
Rising Promoter Confidence
Consistent Returns over the last 3 years
Stock DNA
Plastic Products - Industrial
INR 585 Cr (Micro Cap)
19.00
35
0.27%
-0.11
21.65%
3.98
Total Returns (Price + Dividend) 
Latest dividend: 0.15 per share ex-dividend date: Sep-17-2025
Risk Adjusted Returns v/s
Returns Beta

News

Premier Polyfilm Ltd Shows Mildly Bullish Momentum Amid Technical Shifts
Premier Polyfilm Ltd, a micro-cap player in the Plastic Products - Industrial sector, has recently exhibited a shift in its technical momentum, moving from a sideways trend to a mildly bullish stance. This change is underscored by mixed signals from key technical indicators such as MACD, RSI, Bollinger Bands, and moving averages, suggesting cautious optimism among investors as the stock price edges higher.
Read full news article
Premier Polyfilm Ltd is Rated Hold by MarketsMOJO
Premier Polyfilm Ltd is rated 'Hold' by MarketsMOJO, with this rating last updated on 21 May 2026. However, the analysis and financial metrics discussed here reflect the stock's current position as of 02 June 2026, providing investors with an up-to-date view of the company’s performance and outlook.
Read full news article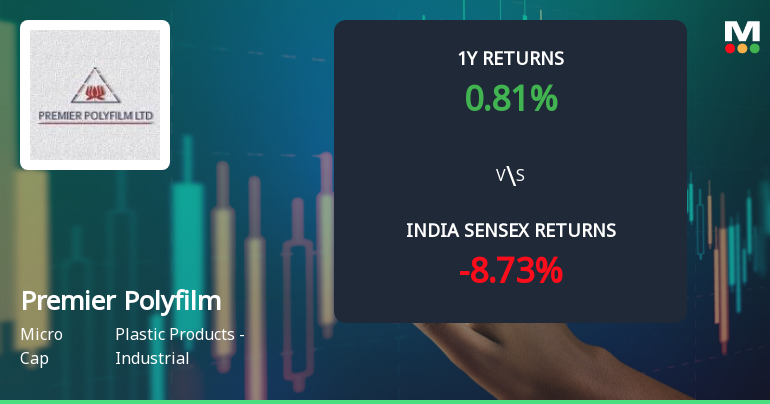
Premier Polyfilm Ltd Technical Momentum Shifts Amid Mixed Market Signals
Premier Polyfilm Ltd, a micro-cap player in the Plastic Products - Industrial sector, has experienced a notable shift in its technical momentum, moving from a mildly bullish stance to a sideways trend. Despite a modest day change of 0.33%, the stock’s technical indicators reveal a complex picture of mixed signals, prompting a reassessment of its near-term price trajectory and investor sentiment.
Read full news article Announcements
Disclosures under Reg. 29(2) of SEBI (SAST) Regulations 2011
10-Jun-2026 | Source : BSEThe Exchange has received the disclosure under Regulation 29(2) of SEBI (Substantial Acquisition of Shares & Takeovers) Regulations 2011 for D L Millar & Co Ltd
Disclosures under Reg. 29(2) of SEBI (SAST) Regulations 2011
10-Jun-2026 | Source : BSEThe Exchange has received the disclosure under Regulation 29(2) of SEBI (Substantial Acquisition of Shares & Takeovers) Regulations 2011 for D L Millar & Co Ltd
Disclosures under Reg. 29(2) of SEBI (SAST) Regulations 2011
02-Jun-2026 | Source : BSEThe Exchange has received the disclosure under Regulation 29(2) of SEBI (Substantial Acquisition of Shares & Takeovers) Regulations 2011 for D L Millar & Co. Ltd
Corporate Actions

No Upcoming Board Meetings

Premier Polyfilm Ltd has declared 15% dividend, ex-date: 17 Sep 25

Premier Polyfilm Ltd has announced 1:5 stock split, ex-date: 05 Nov 24

No Bonus history available

No Rights history available
Quality key factors
Valuation key factors
Technicals key factors
 Technical Indicator Scale: Bearish, Mildly Bearish, Sideways, Mildly Bullish, Bullish Turned
 Shareholding Snapshot : Mar 2026
Shareholding Compare (%holding)
Promoters
0.0301
Held by 0 Schemes
Held by 2 FIIs (0.07%)
Sri Vishvanath Enterprises Ltd (19.61%)
Sanghai Holdings Private Limited (11.18%)
12.44%
Quarterly Results Snapshot (Standalone) - Mar'26 - QoQ

QoQ Growth in quarter ended Mar 2026 is 2.70% vs 8.25% in Dec 2025
QoQ Growth in quarter ended Mar 2026 is -7.54% vs 15.86% in Dec 2025
Half Yearly Results Snapshot (Standalone) - Sep'25

Growth in half year ended Sep 2025 is 4.92% vs 0.13% in Sep 2024
Growth in half year ended Sep 2025 is 1.97% vs 42.09% in Sep 2024
Nine Monthly Results Snapshot (Standalone) - Dec'25
YoY Growth in nine months ended Dec 2025 is 12.45% vs 0.35% in Dec 2024
YoY Growth in nine months ended Dec 2025 is 14.11% vs 46.83% in Dec 2024
Annual Results Snapshot (Standalone) - Mar'26
YoY Growth in year ended Mar 2026 is 12.29% vs 1.55% in Mar 2025
YoY Growth in year ended Mar 2026 is 22.62% vs 26.21% in Mar 2025
About Premier Polyfilm Ltd

Company Coordinates


