
Compare Prevest Denpro with Similar Stocks
Dashboard
Poor long term growth as Net Sales has grown by an annual rate of 12.85% and Operating profit at 7.55% over the last 5 years
Flat results in Mar 26
With ROE of 16.4, it has a Expensive valuation with a 3.8 Price to Book Value
Consistent Underperformance against the benchmark over the last 3 years
Stock DNA
Healthcare Services
INR 469 Cr (Micro Cap)
23.00
91
0.26%
-0.65
16.42%
3.76
Total Returns (Price + Dividend) 
Latest dividend: 1 per share ex-dividend date: Sep-03-2025
Risk Adjusted Returns v/s
Returns Beta

News

Prevest Denpro Ltd is Rated Sell by MarketsMOJO
Prevest Denpro Ltd is rated 'Sell' by MarketsMOJO, with this rating last updated on 06 Nov 2025. However, the analysis and financial metrics discussed here reflect the stock's current position as of 10 June 2026, providing investors with an up-to-date view of the company’s performance and outlook.
Read full news article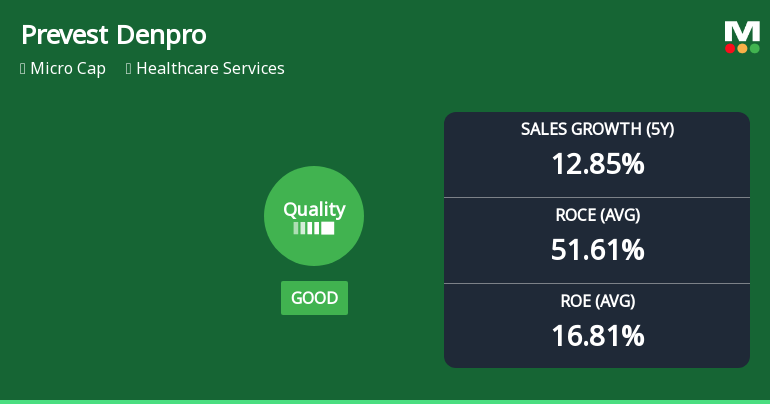
Prevest Denpro Ltd Quality Grade Upgrade Highlights Mixed Business Fundamentals
Prevest Denpro Ltd, a micro-cap player in the Healthcare Services sector, has seen its quality rating upgraded from average to good, reflecting improvements in key financial metrics such as return on capital employed and sales growth. However, despite this positive shift, the company’s overall market performance and fundamental indicators present a mixed picture, warranting a cautious approach from investors.
Read full news article
Prevest Denpro Q4 FY26: Strong Profit Growth Masks Valuation Concerns
Prevest Denpro Ltd., one of the world's leading dental materials manufacturers, reported a robust fourth quarter for FY26, with consolidated net profit surging 23.31% quarter-on-quarter to ₹5.82 crores and 13.23% year-on-year. However, the stock has struggled in the aftermath, trading at ₹400.00 as of May 29, down 35.70% from its 52-week high of ₹622.05, as investors grapple with premium valuations and a mildly bearish technical outlook. The ₹480.12 crore market capitalisation company faces a critical juncture as strong operational performance clashes with stretched multiples.
Read full news article Announcements
Compliances-Reg.24(A)-Annual Secretarial Compliance
30-May-2026 | Source : BSENon-Applicability of Annual Secretarial Compliance Report for the Financial year ended March 31 2026
Intimation Regarding Cancellation Of Schedule Of Analyst / Institutional Investor Meeting Under The SEBI (Listing Obligations And Disclosure Requirements) Regulations 2015.
29-May-2026 | Source : BSEThis is to inform you that the Earnings conference call scheduled to be held on June 02 2026 has been cancelled due to unforeseen circumstances.
Board Meeting Intimation for Audited Financial Results Of The Company For Quarter And Financial Year Ended March 31 2026
21-May-2026 | Source : BSEPrevest Denpro Ltdhas informed BSE that the meeting of the Board of Directors of the Company is scheduled on 27/05/2026 inter alia to consider and approve Audited Financial Results of the Company for quarter and financial year ended March 31 2026
Corporate Actions

No Upcoming Board Meetings

Prevest Denpro Ltd has declared 10% dividend, ex-date: 03 Sep 25

No Splits history available

No Bonus history available

No Rights history available
Quality key factors
Valuation key factors
Technicals key factors
 Technical Indicator Scale: Bearish, Mildly Bearish, Sideways, Mildly Bullish, Bullish Turned
 Shareholding Snapshot : Mar 2026
Shareholding Compare (%holding)
Promoters
None
Held by 0 Schemes
Held by 1 FIIs (0.65%)
Atul Modi (37.52%)
Pushpa Kumari Pankaj Prasoon . (2.29%)
18.62%
Quarterly Results Snapshot (Consolidated) - Mar'26 - QoQ

QoQ Growth in quarter ended Mar 2026 is 2.60% vs -0.97% in Dec 2025
QoQ Growth in quarter ended Mar 2026 is 23.31% vs -14.80% in Dec 2025
Half Yearly Results Snapshot (Consolidated) - Mar'26
Growth in half year ended Mar 2026 is 8.69% vs 3.02% in Sep 2025
Growth in half year ended Mar 2026 is 5.93% vs 2.90% in Sep 2025
Nine Monthly Results Snapshot (Consolidated) - Dec'25
YoY Growth in nine months ended Dec 2025 is 18.60% vs 10.92% in Dec 2024

YoY Growth in nine months ended Dec 2025 is 12.67% vs 14.51% in Dec 2024
Annual Results Snapshot (Consolidated) - Mar'26
YoY Growth in year ended Mar 2026 is 13.93% vs 11.70% in Mar 2025
YoY Growth in year ended Mar 2026 is 12.83% vs 12.52% in Mar 2025
About Prevest Denpro Ltd

Company Coordinates


