
Compare Pricol Ltd with Similar Stocks
Dashboard
High Management Efficiency with a high ROE of 15.65%
Strong ability to service debt as the company has a low Debt to EBITDA ratio of 0.81 times
Healthy long term growth as Operating profit has grown by an annual rate 33.32%
The company has declared Positive results for the last 5 consecutive quarters
High Institutional Holdings at 25.75%
Market Beating performance in long term as well as near term
Stock DNA
Auto Components & Equipments
INR 8,589 Cr (Small Cap)
33.00
37
0.29%
0.20
19.99%
6.62
Total Returns (Price + Dividend) 
Latest dividend: 1.9977913693510025 per share ex-dividend date: Nov-14-2025
Risk Adjusted Returns v/s
Returns Beta

News
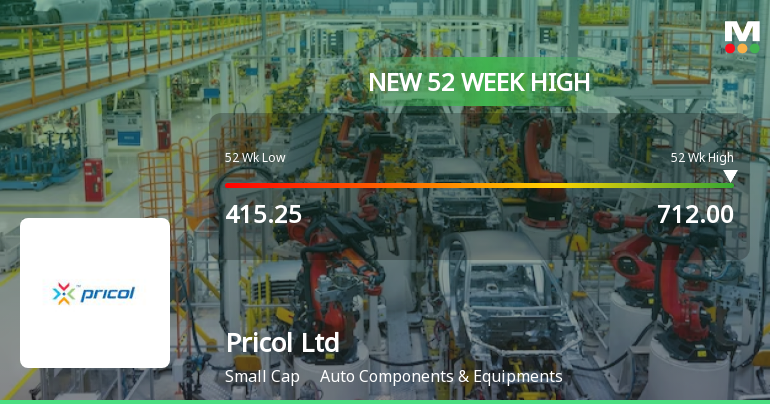
Broad-Based Technical Strength Lifts Pricol Ltd to 52-Week High of Rs 715.25
With a 63.35% gain over the past year, Pricol Ltd has surged from Rs 415.25 to a fresh 52-week and all-time high of Rs 715.25 on 31 Jul 2026, showcasing a powerful momentum that outpaces the Sensex’s decline of 3.95% over the same period.
Read full news article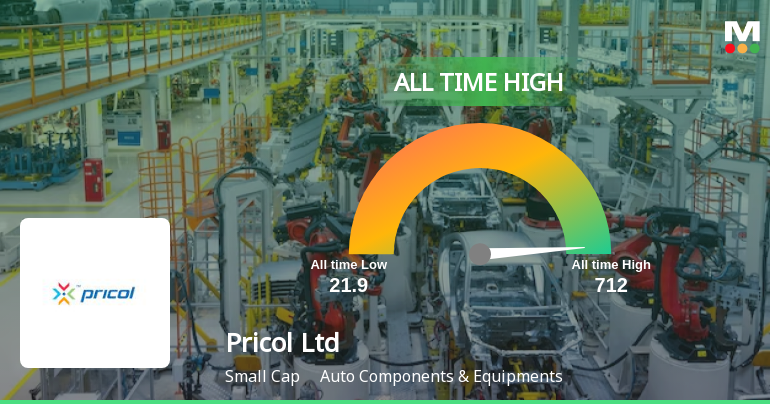
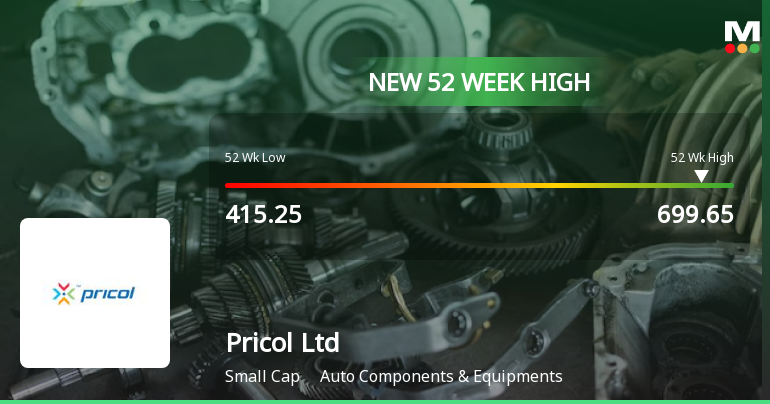
Broad-Based Technical Strength Lifts Pricol Ltd to 52-Week High of Rs 699.65
Pricol Ltd has surged to a fresh 52-week and all-time high of Rs 699.65 on 30 Jul 2026, marking a remarkable 54.96% gain over the past year and significantly outperforming the Sensex, which declined by 4.41% during the same period. This rally is underpinned by a strong alignment of technical indicators and sustained price momentum, reflecting robust market confidence in the stock’s trajectory.
Read full news article Announcements
Announcement under Regulation 30 (LODR)-Analyst / Investor Meet - Intimation
21-Jul-2026 | Source : BSEConference call is scheduled to be held on Friday 31st July 2026 at 04:00 PM to discuss the financial results for the quarter ended 30th June 2026
Announcement under Regulation 30 (LODR)-Newspaper Publication
16-Jul-2026 | Source : BSENewspaper publication - Loss of share certificate
Announcement under Regulation 30 (LODR)-Newspaper Publication
14-Jul-2026 | Source : BSENewspaper publication - 15th AGM Notice
Corporate Actions

No Upcoming Board Meetings

Pricol Ltd has declared 200% dividend, ex-date: 14 Nov 25

No Splits history available

No Bonus history available

Pricol Ltd has announced 2:7 rights issue, ex-date: 24 Nov 20
Quality key factors
Valuation key factors
Technicals key factors
 Technical Indicator Scale: Bearish, Mildly Bearish, Sideways, Mildly Bullish, Bullish Turned
 Shareholding Snapshot : Jun 2026
Shareholding Compare (%holding)
Promoters
None
Held by 14 Schemes (9.86%)
Held by 118 FIIs (13.95%)
Pricol Holdings Private Limited (9.03%)
Goldman Sachs Funds - Goldman Sachs India Equity Portfolio (3.23%)
29.04%
Quarterly Results Snapshot (Consolidated) - Jun'26 - YoY

YoY Growth in quarter ended Jun 2026 is 23.47% vs 44.43% in Jun 2025

YoY Growth in quarter ended Jun 2026 is 34.34% vs 9.50% in Jun 2025
Half Yearly Results Snapshot (Consolidated) - Sep'25
Growth in half year ended Sep 2025 is 47.60% vs 15.58% in Sep 2024
Growth in half year ended Sep 2025 is 25.65% vs 39.24% in Sep 2024
Nine Monthly Results Snapshot (Consolidated) - Dec'25
YoY Growth in nine months ended Dec 2025 is 53.00% vs 13.92% in Dec 2024
YoY Growth in nine months ended Dec 2025 is 34.44% vs 33.27% in Dec 2024
Annual Results Snapshot (Consolidated) - Mar'26
YoY Growth in year ended Mar 2026 is 50.11% vs 18.49% in Mar 2025
YoY Growth in year ended Mar 2026 is 50.15% vs 18.79% in Mar 2025
About Pricol Ltd

Company Coordinates


