
Compare Prit Nandy Comm. with Similar Stocks
Dashboard
With a Operating Losses, the company has a Weak Long Term Fundamental Strength
- Poor long term growth as Operating profit has grown by an annual rate 13.27% of over the last 5 years
- Company's ability to service its debt is weak with a poor EBIT to Interest (avg) ratio of -1.13
Flat results in Mar 26
Risky - Negative EBITDA
Below par performance in long term as well as near term
Stock DNA
Media & Entertainment
INR 30 Cr (Micro Cap)
6.00
66
0.00%
0.01
8.18%
0.47
Total Returns (Price + Dividend) 
Latest dividend: 1 per share ex-dividend date: Sep-11-2008
Risk Adjusted Returns v/s
Returns Beta

News

Pritish Nandy Communications Ltd is Rated Strong Sell
Pritish Nandy Communications Ltd is rated Strong Sell by MarketsMOJO, with this rating last updated on 13 May 2026. However, the analysis and financial metrics discussed here reflect the company’s current position as of 09 July 2026, providing investors with the latest insights into the stock’s performance and fundamentals.
Read full news article
Pritish Nandy Communications Ltd is Rated Strong Sell
Pritish Nandy Communications Ltd is rated Strong Sell by MarketsMOJO. This rating was last updated on 13 May 2026. However, the analysis and financial metrics presented here reflect the company’s current position as of 19 June 2026, providing investors with the latest insights into its performance and outlook.
Read full news article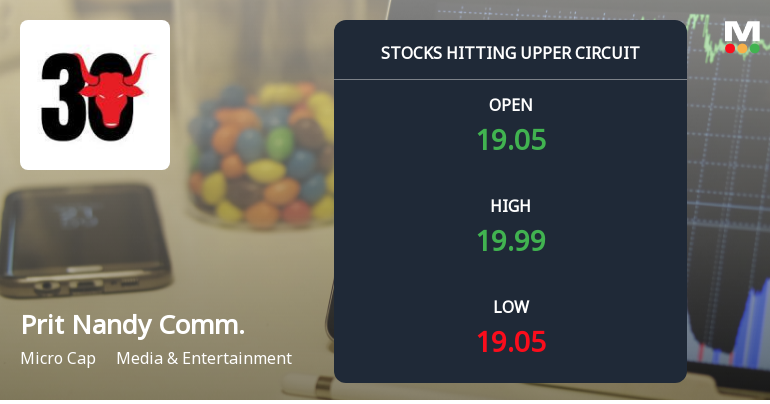
Pritish Nandy Communications Ltd Locks at Upper Circuit With 4.99% Gain — Buyers Queue, Sellers Absent
At Rs 19.98, the buying was done — not because demand dried up, but because the exchange wouldn't let the stock go any higher. Pritish Nandy Communications Ltd locked at its upper circuit of 4.99% on 2 Jun 2026, with buyers queuing and no sellers willing to part with shares.
Read full news article Announcements
Board Meeting Intimation for Considering Unaudited Financial Results (Standalone And Consolidated) For The Quarter Ended June 30 2026
24-Jul-2026 | Source : BSEPritish Nandy Communications Ltdhas informed BSE that the meeting of the Board of Directors of the Company is scheduled on 03/08/2026 inter alia to consider and approve the Unaudited Financial Results (Standalone And Consolidated) along with the Limited Review Report for the Quarter ended June 30 2026
Compliances-Certificate under Reg. 74 (5) of SEBI (DP) Regulations 2018
10-Jul-2026 | Source : BSEWe are enclosing herewith the certificate received from MUFG Intime India Pvt. Ltd. for the quarter ended June 30 2026 certifying compliances with Reg. 74 (5) of SEBI (DP) Regulations 2018
Announcement under Regulation 30 (LODR)-Newspaper Publication
07-Jul-2026 | Source : BSEPlease find enclosed herewith intimation with regards to Newspaper Publication- Notice of Postal Ballot dated July 03 2026
Corporate Actions

03 Aug 2026

Pritish Nandy Communications Ltd has declared 10% dividend, ex-date: 11 Sep 08

No Splits history available

No Bonus history available

No Rights history available
Quality key factors
Valuation key factors
Technicals key factors
 Technical Indicator Scale: Bearish, Mildly Bearish, Sideways, Mildly Bullish, Bullish Turned
 Shareholding Snapshot : Jun 2026
Shareholding Compare (%holding)
Promoters
None
Held by 0 Schemes
Held by 0 FIIs
Ideas.com India Private Limited (21.03%)
Bharati Kamal Morarka (6.12%)
36.05%
Quarterly Results Snapshot (Consolidated) - Mar'26 - YoY

YoY Growth in quarter ended Mar 2026 is -68.04% vs -73.02% in Mar 2025

YoY Growth in quarter ended Mar 2026 is -379.07% vs -138.74% in Mar 2025
Half Yearly Results Snapshot (Consolidated) - Sep'25
Growth in half year ended Sep 2025 is 11.45% vs 4.02% in Sep 2024
Growth in half year ended Sep 2025 is -76.47% vs -121.52% in Sep 2024
Nine Monthly Results Snapshot (Consolidated) - Dec'25
YoY Growth in nine months ended Dec 2025 is 36.21% vs -10.50% in Dec 2024
YoY Growth in nine months ended Dec 2025 is -1,915.38% vs -139.69% in Dec 2024
Annual Results Snapshot (Consolidated) - Mar'26
YoY Growth in year ended Mar 2026 is 12.08% vs -41.79% in Mar 2025
YoY Growth in year ended Mar 2026 is -1,220.00% vs -139.26% in Mar 2025
About Pritish Nandy Communications Ltd

Company Coordinates


