
Key Events This Week
1 Jun: Mixed Q4 FY26 results reported with record revenue but profit volatility
3 Jun: Valuation turns very attractive amid market volatility
5 Jun: Week closes at Rs.11.12 (-0.36%) outperforming Sensex
Jul 30, 10:21 AM
BSE+NSE Vol: 4742
Media & Entertainment
INR 31 Cr (Micro Cap)
4.00
18
0.00%
0.45
17.00%
0.64
Sharpline Broadc for the last several years.


Sharpline Broadcast Ltd is rated 'Sell' by MarketsMOJO, with this rating last updated on 15 Apr 2026. However, the analysis and financial metrics discussed here reflect the stock's current position as of 09 July 2026, providing investors with an up-to-date view of the company’s fundamentals, valuation, financial trends, and technical outlook.
Read full news article
1 Jun: Mixed Q4 FY26 results reported with record revenue but profit volatility
3 Jun: Valuation turns very attractive amid market volatility
5 Jun: Week closes at Rs.11.12 (-0.36%) outperforming Sensex
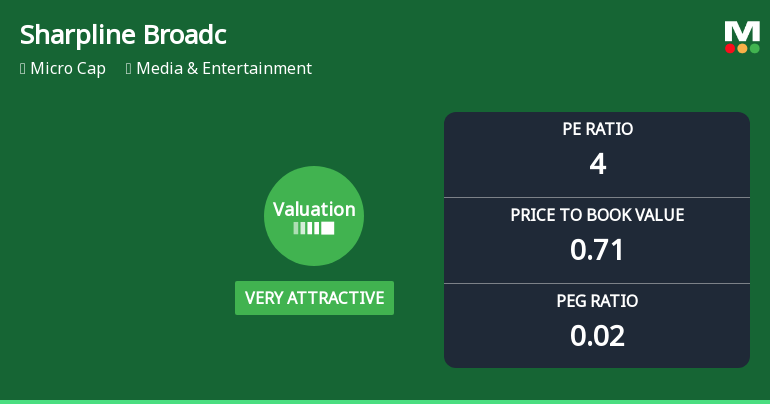
Sharpline Broadcast Ltd has witnessed a significant shift in its valuation parameters, moving from a fair to a very attractive rating, driven by a sharp decline in its price-to-earnings and price-to-book value ratios. This revaluation comes amid a challenging media and entertainment sector landscape, where peers continue to face profitability pressures and elevated multiples.
Read full news articleWe are hereby submitting the Certificate under Regulation 74(5) of the SEBI (Depository & Participant) Regulations 2018 for the quarter ended 30th June 2026. Please find the same enclosed herewith.
Pursuant to the Provision of SEBI (Prohibition of Insider Trading) Regulations 2015 read with the provisions of the Companys Insider Trading code as amended the Trading Window for dealing in the securities of the Company for all Designated Persons/Directors/KMPs/Officers and their immediate relatives with effect from July 01 2026 till 48 hours after the Un-Audited Financial Results of the Company for the quarter ended June 30 2026 becomes generally available to the public. The Date of Board Meeting for declaration of the Un-Audited Financial Results of the Company for the quarter ended June 30 2026 will be intimated in due course. It has been informed to the designated persons that they and their immediate relatives to ensure compliance with the Securities and Exchange Board of India (Prohibition of Insider Trading) Regulations 2015 and shall not trade or deal otherwise in the Companys securities during the above period of trading window closure.
With reference to the above captioned subject please find enclosed herewith the clippings of the English newspaper Financial Express and Hindi Newspaper Jansatta dated 01st Jun 2026 in which Audited Standalone and Consolidated Financial Results for the quarter and year ended 31st May 2026 has been published. This is for your kind information and record please.

No Upcoming Board Meetings

No Dividend history available

No Splits history available

No Bonus history available

No Rights history available
 Technical Indicator Scale: Bearish, Mildly Bearish, Sideways, Mildly Bullish, Bullish Turned
 Non Institution
None
Held by 0 Schemes
Held by 1 FIIs (0.15%)
Spaceship Infra Pvt Ltd (14.3%)
Sadhna Business Network Pvt Ltd (15.73%)
33.3%

QoQ Growth in quarter ended Mar 2026 is 69.70% vs 5.38% in Dec 2025

QoQ Growth in quarter ended Mar 2026 is -39.22% vs 410.98% in Dec 2025
Growth in half year ended Sep 2025 is 41.38% vs -5.95% in Sep 2024
Growth in half year ended Sep 2025 is -6.80% vs -330.30% in Sep 2024
YoY Growth in nine months ended Dec 2025 is 63.93% vs 10.43% in Dec 2024
YoY Growth in nine months ended Dec 2025 is 155.58% vs -268.06% in Dec 2024
YoY Growth in year ended Mar 2026 is 90.43% vs 82.92% in Mar 2025
YoY Growth in year ended Mar 2026 is 537.40% vs -20.13% in Mar 2025


