
Compare Prostarm Info with Similar Stocks
Stock DNA
Other Electrical Equipment
INR 722 Cr (Micro Cap)
22.00
51
0.00%
0.30
11.51%
2.37
Total Returns (Price + Dividend) 
Prostarm Info for the last several years.
Risk Adjusted Returns v/s
Returns Beta

News
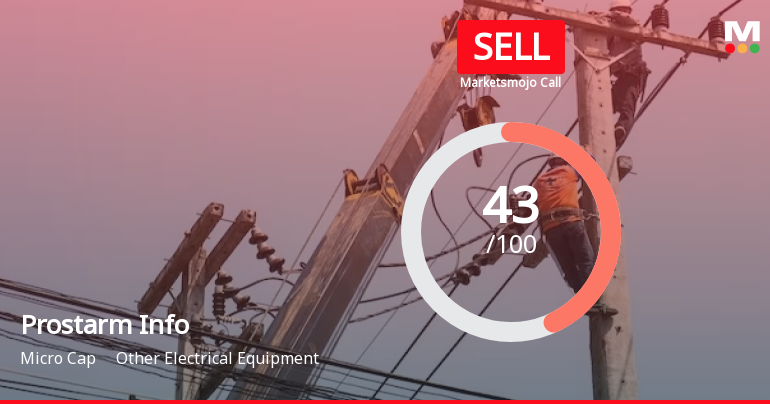
Prostarm Info Systems Ltd is Rated Sell
Prostarm Info Systems Ltd is rated 'Sell' by MarketsMOJO, with this rating last updated on 25 May 2026. However, the analysis and financial metrics discussed here reflect the stock's current position as of 26 July 2026, providing investors with an up-to-date view of the company’s fundamentals, valuation, financial trends, and technical outlook.
Read full news article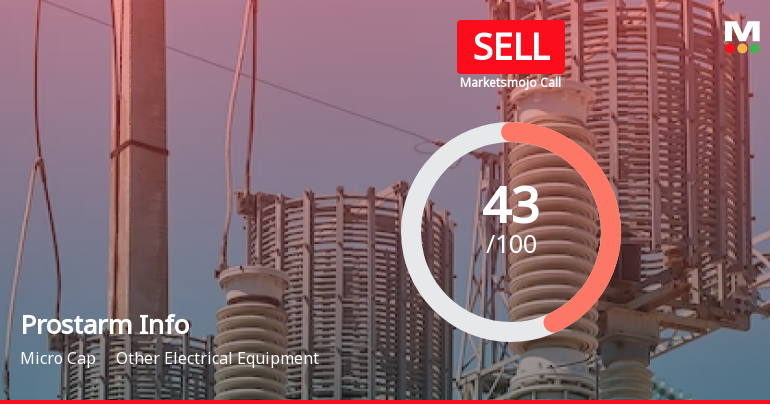
Prostarm Info Systems Ltd is Rated Sell
Prostarm Info Systems Ltd is rated 'Sell' by MarketsMOJO, with this rating last updated on 25 May 2026. However, the analysis and financial metrics discussed here reflect the stock's current position as of 15 July 2026, providing investors with an up-to-date view of the company’s fundamentals, returns, and market standing.
Read full news article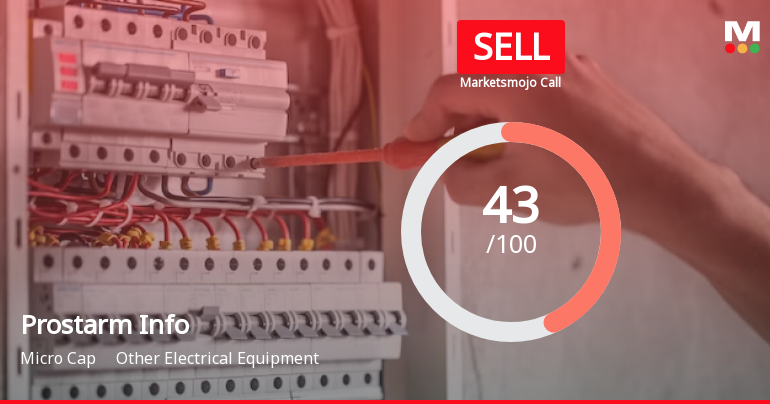
Prostarm Info Systems Ltd is Rated Sell
Prostarm Info Systems Ltd is rated 'Sell' by MarketsMOJO, with this rating last updated on 25 May 2026. However, the analysis and financial metrics discussed here reflect the stock's current position as of 04 July 2026, providing investors with the most up-to-date insight into the company’s performance and outlook.
Read full news article Announcements
Intimation Of Cancellation Of L1 Of Karnataka State Fire And Emergency Services
23-Jul-2026 | Source : BSEAs attached
Intimation Of Cancellation Of L1 Of West Bengal Medical Services Corporation (WBMSC) Kolkata.
17-Jul-2026 | Source : BSEAs attached
Update - Revision In Timeline For Commencement Of Commercial Production At The Proposed Manufacturing Facilities
15-Jul-2026 | Source : BSEAs attached
Corporate Actions

No Upcoming Board Meetings

No Dividend history available

No Splits history available

No Bonus history available

No Rights history available
Quality key factors
Valuation key factors
Technicals key factors
 Technical Indicator Scale: Bearish, Mildly Bearish, Sideways, Mildly Bullish, Bullish Turned
 Shareholding Snapshot : Jun 2026
Shareholding Compare (%holding)
Promoters
None
Held by 0 Schemes
Held by 9 FIIs (0.51%)
Vikas Shyamsunder Agarwal (24.03%)
None
22.19%
Quarterly Results Snapshot (Standalone) - Mar'26 - QoQ

QoQ Growth in quarter ended Mar 2026 is -35.39% vs 146.62% in Dec 2025
QoQ Growth in quarter ended Mar 2026 is -45.11% vs 88.65% in Dec 2025
Half Yearly Results Snapshot (Standalone) - Sep'25
Not Applicable: The company has declared_date for only one period
Not Applicable: The company has declared_date for only one period
Nine Monthly Results Snapshot (Standalone) - Dec'25
Not Applicable: The company has declared_date for only one period
Not Applicable: The company has declared_date for only one period
Annual Results Snapshot (Consolidated) - Mar'26
YoY Growth in year ended Mar 2026 is 10.02% vs 35.98% in Mar 2025
YoY Growth in year ended Mar 2026 is 11.22% vs 27.33% in Mar 2025
About Prostarm Info Systems Ltd

Company Coordinates


