
Compare Prostarm Info with Similar Stocks
Stock DNA
Other Electrical Equipment
INR 818 Cr (Micro Cap)
25.00
56
0.00%
0.30
11.51%
2.69
Total Returns (Price + Dividend) 
Prostarm Info for the last several years.
Risk Adjusted Returns v/s
Returns Beta

News

Prostarm Info Systems Ltd is Rated Sell
Prostarm Info Systems Ltd is rated 'Sell' by MarketsMOJO, with this rating last updated on 25 May 2026. However, the analysis and financial metrics discussed here reflect the stock's current position as of 12 June 2026, providing investors with the most up-to-date view of the company’s fundamentals, returns, and market standing.
Read full news article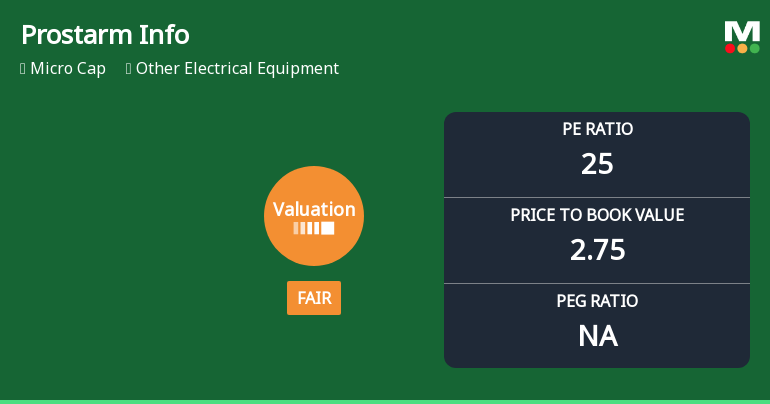
Prostarm Info Systems Ltd Valuation Shifts Signal Changing Market Sentiment
Prostarm Info Systems Ltd, a micro-cap player in the Other Electrical Equipment sector, has experienced a notable shift in its valuation parameters, moving from an attractive to a fair valuation grade. This article analyses the recent changes in key valuation metrics such as the price-to-earnings (P/E) and price-to-book value (P/BV) ratios, compares them with peer companies, and assesses the implications for investors amid a mixed market backdrop.
Read full news article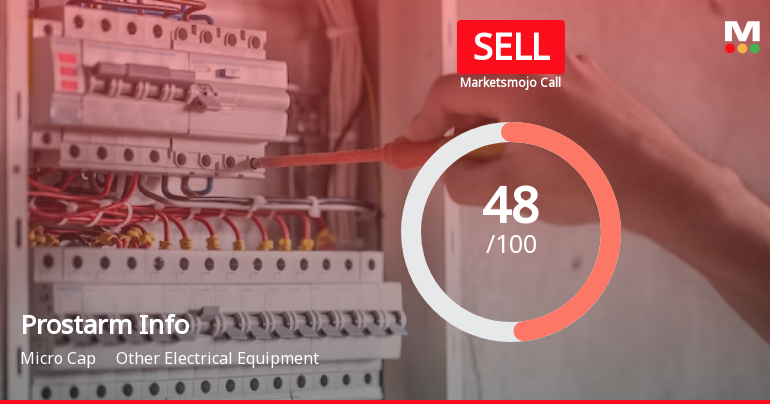
Prostarm Info Systems Ltd is Rated Sell
Prostarm Info Systems Ltd is rated 'Sell' by MarketsMOJO, with this rating last updated on 25 May 2026. However, the analysis and financial metrics discussed here reflect the stock's current position as of 01 June 2026, providing investors with the most up-to-date view of the company’s fundamentals, valuation, financial trends, and technical outlook.
Read full news article Announcements
Announcement under Regulation 30 (LODR)-Analyst / Investor Meet - Intimation
08-Jun-2026 | Source : BSESchedule of Analysts / Institutional Investor Meet - InsightX 2026
Announcement under Regulation 30 (LODR)-Analyst / Investor Meet - Intimation
03-Jun-2026 | Source : BSEIntimation regarding Schedule of Group of Analysts Meet
Announcement under Regulation 30 (LODR)-Analyst / Investor Meet - Outcome
28-May-2026 | Source : BSETranscript of Earnings Conference Call for the Quarter and Year ended March 31 2026
Corporate Actions

No Upcoming Board Meetings

No Dividend history available

No Splits history available

No Bonus history available

No Rights history available
Quality key factors
Valuation key factors
Technicals key factors
 Technical Indicator Scale: Bearish, Mildly Bearish, Sideways, Mildly Bullish, Bullish Turned
 Shareholding Snapshot : Mar 2026
Shareholding Compare (%holding)
Promoters
None
Held by 0 Schemes
Held by 9 FIIs (0.86%)
Vikas Shyamsunder Agarwal (24.03%)
None
22.51%
Quarterly Results Snapshot (Standalone) - Mar'26 - QoQ

QoQ Growth in quarter ended Mar 2026 is -35.39% vs 146.62% in Dec 2025
QoQ Growth in quarter ended Mar 2026 is -45.11% vs 88.65% in Dec 2025
Half Yearly Results Snapshot (Standalone) - Sep'25
Not Applicable: The company has declared_date for only one period
Not Applicable: The company has declared_date for only one period
Nine Monthly Results Snapshot (Standalone) - Dec'25
Not Applicable: The company has declared_date for only one period
Not Applicable: The company has declared_date for only one period
Annual Results Snapshot (Consolidated) - Mar'26
YoY Growth in year ended Mar 2026 is 10.02% vs 35.98% in Mar 2025
YoY Growth in year ended Mar 2026 is 11.22% vs 27.33% in Mar 2025
About Prostarm Info Systems Ltd

Company Coordinates


