
Compare Protean eGov with Similar Stocks
Stock DNA
Computers - Software & Consulting
INR 2,520 Cr (Small Cap)
24.00
21
1.61%
-0.22
9.68%
2.34
Total Returns (Price + Dividend) 
Latest dividend: 10 per share ex-dividend date: Aug-29-2025
Risk Adjusted Returns v/s
Returns Beta

News
When is the next results date for Protean eGov Technologies Ltd?
The next results date for Protean eGov Technologies Ltd is scheduled for 04 August 2026....
Read full news article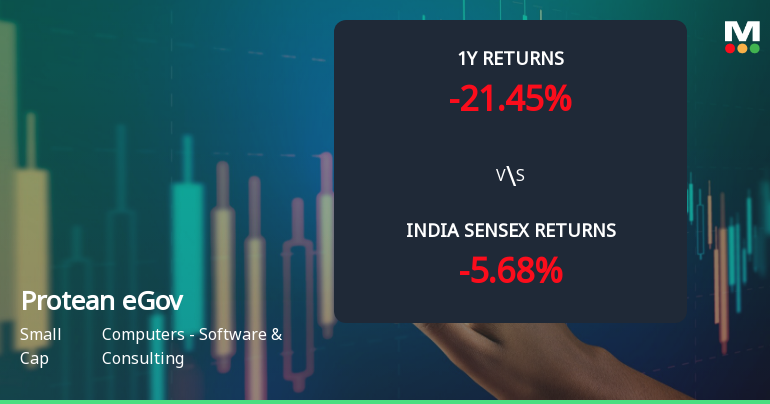
Protean eGov Technologies Ltd Sees Mixed Technical Signals Amid Price Momentum Shift
Protean eGov Technologies Ltd has experienced a notable shift in price momentum, reflected in a complex interplay of technical indicators that suggest a transition from a mildly bearish trend to a sideways movement. Despite a strong intraday gain of 5.37% to close at ₹625.90, the stock’s broader technical landscape remains nuanced, with mixed signals from MACD, RSI, moving averages, and other key metrics.
Read full news article
Protean eGov Technologies Ltd is Rated Sell
Protean eGov Technologies Ltd is rated 'Sell' by MarketsMOJO, with this rating last updated on 27 May 2026. However, the analysis and financial metrics discussed here reflect the stock's current position as of 23 July 2026, providing investors with an up-to-date view of the company’s fundamentals, valuation, financial trends, and technical outlook.
Read full news article Announcements
Announcement under Regulation 30 (LODR)-Analyst / Investor Meet - Intimation
28-Jul-2026 | Source : BSEEarnings Call Intimation - Q1FY27
Board Meeting Intimation for Intimation For Board Meeting - August 4 2026
27-Jul-2026 | Source : BSEProtean Egov Technologies Ltdhas informed BSE that the meeting of the Board of Directors of the Company is scheduled on 04/08/2026 inter alia to consider and approve Intimation for Board Meeting scheduled to be held on August 4 2026
Announcement under Regulation 30 (LODR)-Newspaper Publication
17-Jul-2026 | Source : BSENewspaper Publication - Postal Ballot Notice
Corporate Actions

04 Aug 2026

Protean eGov Technologies Ltd has declared 100% dividend, ex-date: 29 Aug 25

No Splits history available

No Bonus history available

No Rights history available
Quality key factors
Valuation key factors
Technicals key factors
 Technical Indicator Scale: Bearish, Mildly Bearish, Sideways, Mildly Bullish, Bullish Turned
 Shareholding Snapshot : Jun 2026
Shareholding Compare (%holding)
Non Institution
None
Held by 1 Schemes (2.22%)
Held by 21 FIIs (6.01%)
None
Administrator Of The Specified Undertaking Ofthe Unit Trust Of India-unit Scheme 1964 (5.13%)
58.32%
Quarterly Results Snapshot (Consolidated) - Mar'26 - QoQ

QoQ Growth in quarter ended Mar 2026 is 34.37% vs -8.63% in Dec 2025
QoQ Growth in quarter ended Mar 2026 is 35.02% vs -5.70% in Dec 2025
Half Yearly Results Snapshot (Consolidated) - Sep'25
Growth in half year ended Sep 2025 is 10.84% vs -8.74% in Sep 2024
Growth in half year ended Sep 2025 is -2.89% vs -24.40% in Sep 2024
Nine Monthly Results Snapshot (Consolidated) - Dec'25
YoY Growth in nine months ended Dec 2025 is 11.59% vs -6.27% in Dec 2024
YoY Growth in nine months ended Dec 2025 is -2.57% vs -10.17% in Dec 2024
Annual Results Snapshot (Consolidated) - Mar'26
YoY Growth in year ended Mar 2026 is 18.68% vs -4.69% in Mar 2025
YoY Growth in year ended Mar 2026 is 8.79% vs -4.96% in Mar 2025
About Protean eGov Technologies Ltd

Company Coordinates


