
Compare Quadrant Future with Similar Stocks
Dashboard
With a Operating Losses, the company has a Weak Long Term Fundamental Strength
- Poor long term growth as Net Sales has grown by an annual rate of 0.00% and Operating profit at -236.77% over the last 5 years
- Company's ability to service its debt is weak with a poor EBIT to Interest (avg) ratio of -10.95
Flat results in Mar 26
Risky - Negative EBITDA
Falling Participation by Institutional Investors
Stock DNA
Cables - Electricals
INR 1,798 Cr (Micro Cap)
NA (Loss Making)
60
0.00%
-0.03
-16.65%
7.01
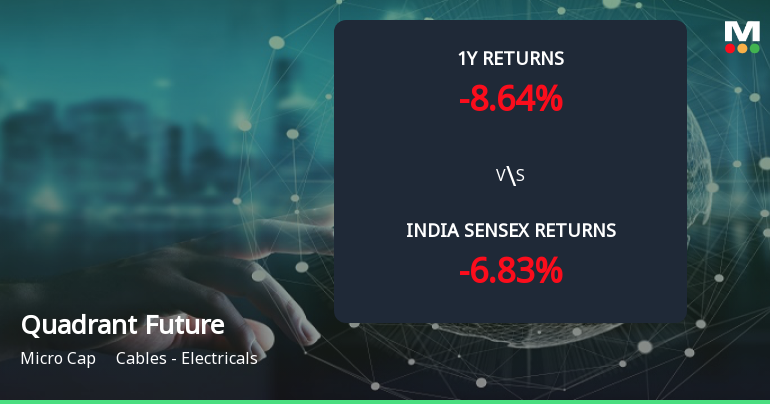
Total Returns (Price + Dividend) 
Quadrant Future for the last several years.
Risk Adjusted Returns v/s
Returns Beta

News
Golden Cross Forms in Quadrant Future Tek Ltd — On a Day the Stock Fell 0.83%. What the Mixed Signals Mean
The 50-day moving average has crossed above the 200-day moving average for Quadrant Future Tek Ltd, signalling a golden cross on 25 Jun 2026. Yet, the stock declined 0.83% on the day this technical event occurred, and monthly momentum indicators remain absent or bearish. This juxtaposition of signals calls for a detailed examination of whether the golden cross is a reliable indicator or a misleading signal in this context.
Read full news article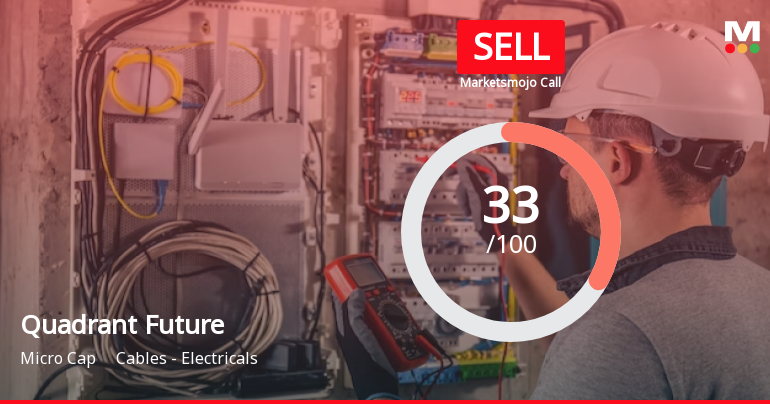
Quadrant Future Tek Ltd is Rated Sell
Quadrant Future Tek Ltd is rated 'Sell' by MarketsMOJO, with this rating last updated on 02 June 2026. However, the analysis and financial metrics discussed here reflect the stock's current position as of 25 June 2026, providing investors with the latest insights into its performance and outlook.
Read full news article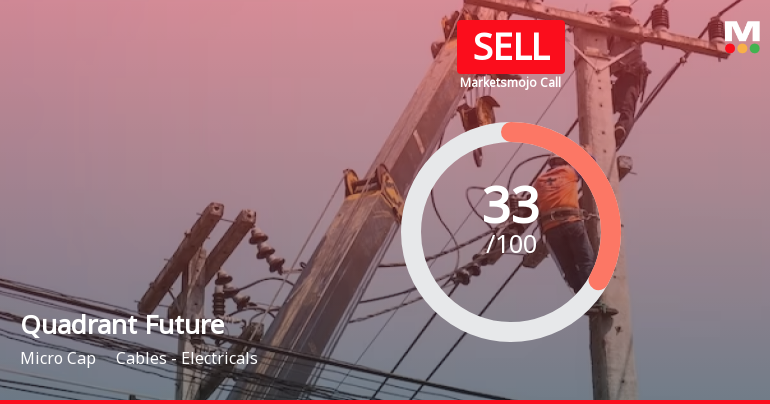
Quadrant Future Tek Ltd is Rated Sell
Quadrant Future Tek Ltd is rated Sell by MarketsMOJO. This rating was last updated on 02 June 2026, reflecting a shift from a previous Strong Sell grade. However, the analysis and financial metrics presented here are based on the stock’s current position as of 14 June 2026, providing investors with the latest insights into the company’s performance and outlook.
Read full news article Announcements
Corporate Actions

No Upcoming Board Meetings

No Dividend history available

No Splits history available

No Bonus history available

No Rights history available
Quality key factors
Valuation key factors
Technicals key factors
 Technical Indicator Scale: Bearish, Mildly Bearish, Sideways, Mildly Bullish, Bullish Turned
 Shareholding Snapshot : Mar 2026
Shareholding Compare (%holding)
Promoters
None
Held by 1 Schemes (1.0%)
Held by 1 FIIs (0.02%)
Rupinder Singh (13.5%)
Suryavanshi Commotrade Private Limited (1.91%)
20.64%
Quarterly Results Snapshot (Standalone) - Dec'25 - QoQ

QoQ Growth in quarter ended Dec 2025 is -3.26% vs 19.74% in Sep 2025

QoQ Growth in quarter ended Dec 2025 is 7.49% vs -17.70% in Sep 2025
Half Yearly Results Snapshot (Standalone) - Sep'25
Growth in half year ended Sep 2025 is -3.09% vs 5.85% in Sep 2024
Growth in half year ended Sep 2025 is -142.81% vs -181.26% in Sep 2024
Nine Monthly Results Snapshot (Standalone) - Dec'25
YoY Growth in nine months ended Dec 2025 is 4.62% vs -2.82% in Dec 2024
YoY Growth in nine months ended Dec 2025 is -114.50% vs -10,915.79% in Dec 2024
Annual Results Snapshot (Standalone) - Mar'26
YoY Growth in year ended Mar 2026 is 1.57% vs -0.76% in Mar 2025
YoY Growth in year ended Mar 2026 is -118.19% vs -269.36% in Mar 2025
About Quadrant Future Tek Ltd

Company Coordinates


