
Compare Quadrant Future with Similar Stocks
Dashboard
Weak Long Term Fundamental Strength as the company has not declared results in the last 6 months
- Poor long term growth as Net Sales has grown by an annual rate of 0.00% and Operating profit at -236.77% over the last 5 years
- Company's ability to service its debt is weak with a poor EBIT to Interest (avg) ratio of -10.95
Flat results in Mar 26
Risky - Negative EBITDA
Underperformed the market in the last 1 year
Stock DNA
Cables - Electricals
INR 1,620 Cr (Micro Cap)
NA (Loss Making)
55
0.00%
-0.03
-16.65%
6.27
Total Returns (Price + Dividend) 
Quadrant Future for the last several years.
Risk Adjusted Returns v/s
Returns Beta

News
Quadrant Future Tek Ltd is Rated Sell
Quadrant Future Tek Ltd is rated 'Sell' by MarketsMOJO, with this rating last updated on 02 June 2026. However, the analysis and financial metrics discussed here reflect the stock's current position as of 17 July 2026, providing investors with the most recent and relevant data to assess the company’s outlook.
Read full news article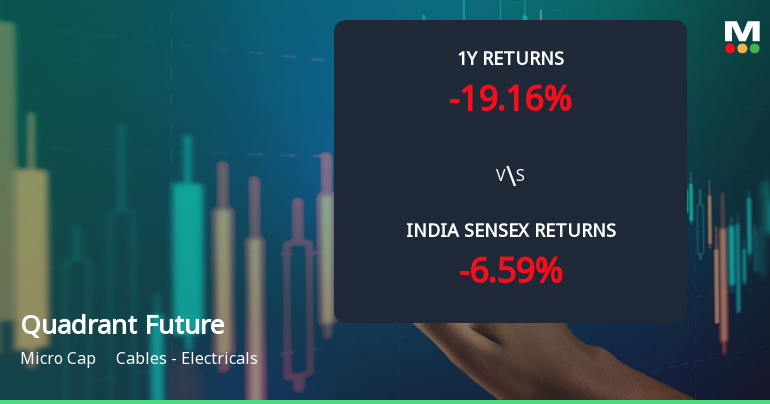
Quadrant Future Tek Ltd Technical Momentum Shifts Amid Mixed Market Returns
Quadrant Future Tek Ltd, a micro-cap player in the Cables - Electricals sector, has experienced a notable shift in its technical momentum, reflecting a complex interplay of bullish and bearish signals. Despite a recent downgrade in its Mojo Grade from Strong Sell to Sell, the stock’s technical indicators reveal a nuanced picture that investors should carefully analyse amid ongoing market volatility.
Read full news article
Quadrant Future Tek Ltd is Rated Sell
Quadrant Future Tek Ltd is rated 'Sell' by MarketsMOJO, with this rating last updated on 02 June 2026. However, the analysis and financial metrics discussed here reflect the stock's current position as of 06 July 2026, providing investors with the latest insights into the company’s fundamentals, valuation, financial trends, and technical outlook.
Read full news article Announcements
Corporate Actions

No Upcoming Board Meetings

No Dividend history available

No Splits history available

No Bonus history available

No Rights history available
Quality key factors
Valuation key factors
Technicals key factors
 Technical Indicator Scale: Bearish, Mildly Bearish, Sideways, Mildly Bullish, Bullish Turned
 Shareholding Snapshot : Jun 2026
Shareholding Compare (%holding)
Promoters
None
Held by 1 Schemes (1.55%)
Held by 5 FIIs (1.84%)
Rupinder Singh (13.5%)
Suryavanshi Commotrade Private Limited (1.91%)
18.57%
Quarterly Results Snapshot (Standalone) - Dec'25 - QoQ

QoQ Growth in quarter ended Dec 2025 is -3.26% vs 19.74% in Sep 2025

QoQ Growth in quarter ended Dec 2025 is 7.49% vs -17.70% in Sep 2025
Half Yearly Results Snapshot (Standalone) - Sep'25
Growth in half year ended Sep 2025 is -3.09% vs 5.85% in Sep 2024
Growth in half year ended Sep 2025 is -142.81% vs -181.26% in Sep 2024
Nine Monthly Results Snapshot (Standalone) - Dec'25
YoY Growth in nine months ended Dec 2025 is 4.62% vs -2.82% in Dec 2024
YoY Growth in nine months ended Dec 2025 is -114.50% vs -10,915.79% in Dec 2024
Annual Results Snapshot (Standalone) - Mar'26
YoY Growth in year ended Mar 2026 is 1.57% vs -0.76% in Mar 2025
YoY Growth in year ended Mar 2026 is -118.19% vs -269.36% in Mar 2025
About Quadrant Future Tek Ltd

Company Coordinates


