
Compare Quadrant Future with Similar Stocks
Dashboard
With a Operating Losses, the company has a Weak Long Term Fundamental Strength
- Poor long term growth as Net Sales has grown by an annual rate of 0.00% and Operating profit at -236.77% over the last 5 years
- Company's ability to service its debt is weak with a poor EBIT to Interest (avg) ratio of -10.95
Flat results in Mar 26
Risky - Negative EBITDA
Falling Participation by Institutional Investors
Underperformed the market in the last 1 year
Stock DNA
Cables - Electricals
INR 1,350 Cr (Micro Cap)
NA (Loss Making)
56
0.00%
-0.03
-16.65%
5.15
Total Returns (Price + Dividend) 
Quadrant Future for the last several years.
Risk Adjusted Returns v/s
Returns Beta

News

Quadrant Future Tek Ltd Upgraded to Sell on Improved Financial and Technical Trends
Quadrant Future Tek Ltd, a micro-cap player in the Cables - Electricals sector, has seen its investment rating upgraded from Strong Sell to Sell as of 2 June 2026. This revision reflects a nuanced improvement across key parameters including financial performance, technical indicators, valuation, and overall quality, despite persistent long-term challenges. The company’s recent quarterly results and market behaviour have prompted analysts to reassess its outlook, signalling cautious optimism amid ongoing risks.
Read full news article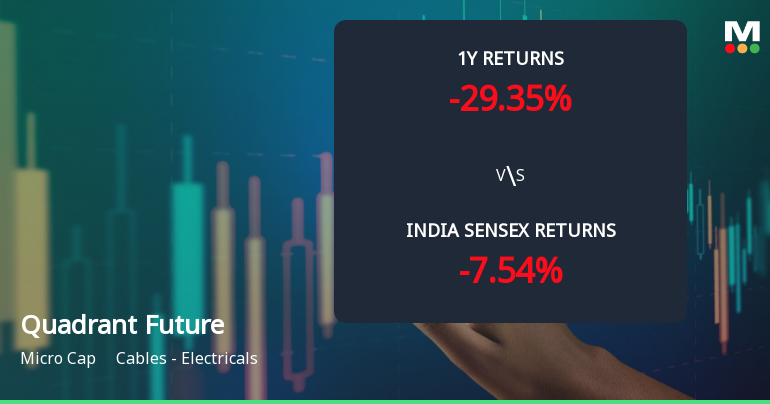
Quadrant Future Tek Ltd Shows Mildly Bullish Momentum Amid Technical Shifts
Quadrant Future Tek Ltd, a micro-cap player in the Cables - Electricals sector, has exhibited a subtle shift in price momentum, moving from a sideways trend to a mildly bullish stance on weekly charts. Despite a recent downgrade in its Mojo Grade to 'Sell' from 'Strong Sell', the stock's technical indicators reveal a nuanced picture that investors should carefully analyse amid ongoing market volatility.
Read full news article
Quadrant Future Tek Ltd Sees Technical Momentum Shift Amid Mixed Market Returns
Quadrant Future Tek Ltd, a micro-cap player in the electrical cables sector, has experienced a notable shift in price momentum, reflected in a strong intraday gain of 11.17% to close at ₹324.05 on 2 June 2026. Despite this surge, technical indicators present a nuanced picture, with some signals improving while others remain inconclusive, underscoring a complex outlook for investors.
Read full news article Announcements
Announcement under Regulation 30 (LODR)-Investor Presentation
29-May-2026 | Source : BSEInvestor Presentation for the Q4 and year ended 31st March 2026
Announcement under Regulation 30 (LODR)-Newspaper Publication
29-May-2026 | Source : BSEIntimation for Newspaper Publication of Audited Financial Results for the Quarter and year ended 31st March 2026
Update Regarding Approval Process W.R.T Kavach System (Version 4.0)
26-May-2026 | Source : BSEIntimation regarding update on approval process w.r.t. KAVACH System (Ver 4.0)
Corporate Actions

No Upcoming Board Meetings

No Dividend history available

No Splits history available

No Bonus history available

No Rights history available
Quality key factors
Valuation key factors
Technicals key factors
 Technical Indicator Scale: Bearish, Mildly Bearish, Sideways, Mildly Bullish, Bullish Turned
 Shareholding Snapshot : Mar 2026
Shareholding Compare (%holding)
Promoters
None
Held by 1 Schemes (1.0%)
Held by 1 FIIs (0.02%)
Rupinder Singh (13.5%)
Suryavanshi Commotrade Private Limited (1.91%)
20.64%
Quarterly Results Snapshot (Standalone) - Dec'25 - QoQ

QoQ Growth in quarter ended Dec 2025 is -3.26% vs 19.74% in Sep 2025

QoQ Growth in quarter ended Dec 2025 is 7.49% vs -17.70% in Sep 2025
Half Yearly Results Snapshot (Standalone) - Sep'25
Growth in half year ended Sep 2025 is -3.09% vs 5.85% in Sep 2024
Growth in half year ended Sep 2025 is -142.81% vs -181.26% in Sep 2024
Nine Monthly Results Snapshot (Standalone) - Dec'25
YoY Growth in nine months ended Dec 2025 is 4.62% vs -2.82% in Dec 2024
YoY Growth in nine months ended Dec 2025 is -114.50% vs -10,915.79% in Dec 2024
Annual Results Snapshot (Standalone) - Mar'26
YoY Growth in year ended Mar 2026 is 1.57% vs -0.76% in Mar 2025
YoY Growth in year ended Mar 2026 is -118.19% vs -269.36% in Mar 2025
About Quadrant Future Tek Ltd

Company Coordinates


