
Compare Quick Heal Tech with Similar Stocks
Dashboard
Poor long term growth as Net Sales has grown by an annual rate of -4.76% and Operating profit at -181.28% over the last 5 years
The company declared negative results in Mar'26 after flat results in Dec'25
Risky - Negative EBITDA
Falling Participation by Institutional Investors
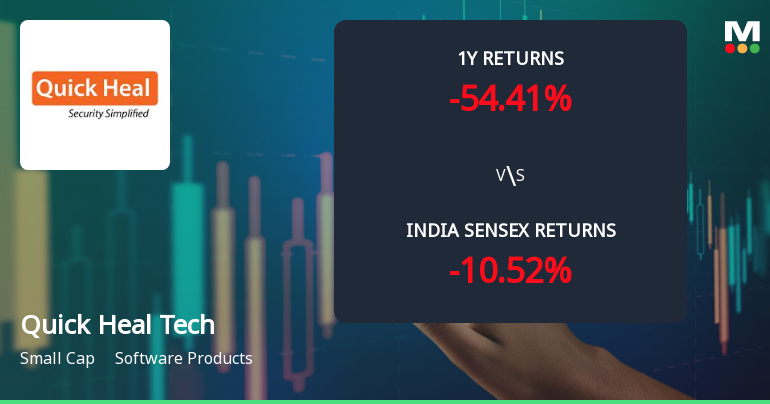
Underperformed the market in the last 1 year
Stock DNA
Software Products
INR 911 Cr (Small Cap)
NA (Loss Making)
20
0.00%
-0.50
-2.50%
2.07
Total Returns (Price + Dividend) 
Latest dividend: 3 per share ex-dividend date: Aug-30-2024
Risk Adjusted Returns v/s
Returns Beta

News
Quick Heal Technologies Ltd Faces Intensified Bearish Momentum Amid Technical Downgrade
Quick Heal Technologies Ltd has experienced a marked shift in price momentum, with technical indicators signalling a deteriorating outlook. The stock’s recent performance, combined with bearish signals from key metrics such as moving averages and Bollinger Bands, suggests mounting pressure on this small-cap software products company amid broader market challenges.
Read full news article
Quick Heal Technologies Ltd is Rated Strong Sell
Quick Heal Technologies Ltd is rated Strong Sell by MarketsMOJO, with this rating last updated on 22 May 2026. However, the analysis and financial metrics discussed here reflect the stock's current position as of 09 June 2026, providing investors with an up-to-date view of the company’s fundamentals, returns, and market standing.
Read full news article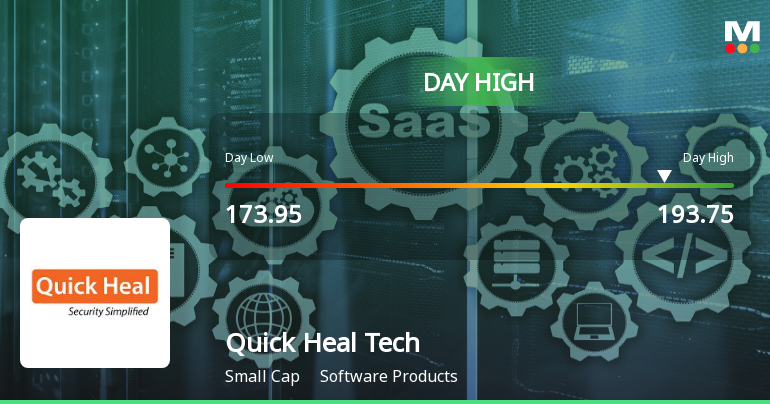
Quick Heal Technologies Ltd Surges 8.79% to Day's High of Rs 191.75 — Outperforms Sector by 6.62 Percentage Points
The Sensex declined by 0.39% on 2 Jun 2026, while Quick Heal Technologies Ltd surged 8.79%, outperforming its sector by 6.62 percentage points. This sharp single-session gain stands out amid a broadly weak market, signalling a stock-specific event rather than a general market uplift.
Read full news article Announcements
Announcement under Regulation 30 (LODR)-Allotment of ESOP / ESPS
29-May-2026 | Source : BSEAllotment of 500 Equity Shares under ESOP Scheme 2021
Announcement under Regulation 30 (LODR)-Analyst / Investor Meet - Outcome
28-May-2026 | Source : BSETranscript for Earnings Call
Compliances-Reg.24(A)-Annual Secretarial Compliance
27-May-2026 | Source : BSEAnnual Secretarial Compliance Report
Corporate Actions

No Upcoming Board Meetings

Quick Heal Technologies Ltd has declared 30% dividend, ex-date: 30 Aug 24

No Splits history available

No Bonus history available

No Rights history available
Quality key factors
Valuation key factors
Technicals key factors
 Technical Indicator Scale: Bearish, Mildly Bearish, Sideways, Mildly Bullish, Bullish Turned
 Shareholding Snapshot : Mar 2026
Shareholding Compare (%holding)
Promoters
None
Held by 1 Schemes (0.0%)
Held by 9 FIIs (0.73%)
Sanjay Sahebrao Katkar (28.74%)
Jatinder Agarwal (1.47%)
21.76%
Quarterly Results Snapshot (Consolidated) - Mar'26 - YoY

YoY Growth in quarter ended Mar 2026 is -25.19% vs -18.61% in Mar 2025
YoY Growth in quarter ended Mar 2026 is -513.54% vs -123.15% in Mar 2025
Half Yearly Results Snapshot (Consolidated) - Sep'25
Growth in half year ended Sep 2025 is -2.11% vs 10.77% in Sep 2024
Growth in half year ended Sep 2025 is -70.66% vs 5,742.86% in Sep 2024
Nine Monthly Results Snapshot (Consolidated) - Dec'25
YoY Growth in nine months ended Dec 2025 is -0.98% vs 1.26% in Dec 2024

YoY Growth in nine months ended Dec 2025 is 8.69% vs -18.73% in Dec 2024
Annual Results Snapshot (Consolidated) - Mar'26
YoY Growth in year ended Mar 2026 is -6.62% vs -4.19% in Mar 2025
YoY Growth in year ended Mar 2026 is -316.87% vs -79.21% in Mar 2025
About Quick Heal Technologies Ltd

Company Coordinates


