
Compare R&B Denims with Similar Stocks
Stock DNA
Garments & Apparels
INR 270 Cr (Micro Cap)
11.00
26
0.00%
0.22
12.38%
1.33
Total Returns (Price + Dividend) 
R&B Denims for the last several years.
Risk Adjusted Returns v/s
Returns Beta

News

R&B Denims Ltd is Rated Sell
R&B Denims Ltd is rated Sell by MarketsMOJO, with this rating last updated on 21 April 2026. While the rating change occurred on that date, the analysis and financial metrics discussed here reflect the stock’s current position as of 19 July 2026, providing investors with an up-to-date perspective on the company’s performance and outlook.
Read full news article
R&B Denims Ltd is Rated Sell
R&B Denims Ltd is rated Sell by MarketsMOJO, with this rating last updated on 21 April 2026. However, the analysis and financial metrics discussed here reflect the stock's current position as of 08 July 2026, providing investors with an up-to-date view of the company’s fundamentals, returns, and market performance.
Read full news article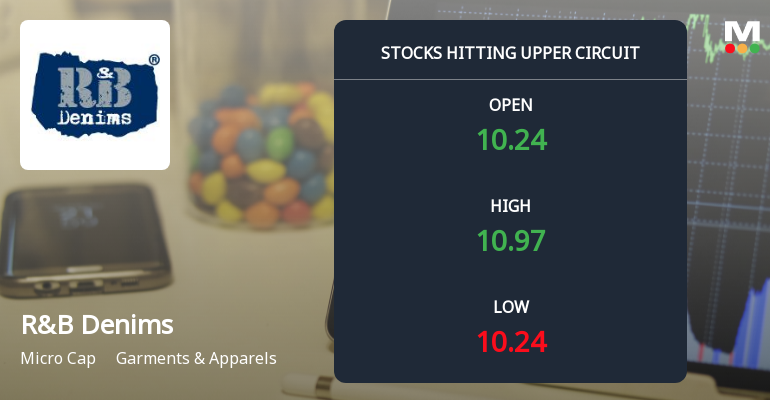
R&B Denims Ltd Locks at Upper Circuit With 4.93% Gain — Buyers Queue, Sellers Absent
At Rs 10.86, the buying was done — not because demand dried up, but because the exchange wouldn't let the stock go any higher. R&B Denims Ltd locked at its upper circuit of 4.93% on 3 Jul 2026, with buyers queuing and no sellers willing to part with shares.
Read full news article Announcements
Reg. 34 (1) Annual Report.
15-Jul-2026 | Source : BSEAnnual Report for the Financial Year 2025-26
Annual Report For Financial Year 2025-26
14-Jul-2026 | Source : BSEPlease find enclosed herewith the Annual Report for financial Year 2025-26 of the Company.
Please Find Enclosed Herewith The Notice Of 16Th Annual General Meeting Of The Company Through Video Conferencing(VC) Or Other Audio Visual Means(OAVM)
14-Jul-2026 | Source : BSENotice of 16th Annual Genreral Meeting of the company through Video Conferencing or other Audio Visual means(OAVM) on Wednesday August 05 2026
Corporate Actions

No Upcoming Board Meetings

No Dividend history available

R&B Denims Ltd has announced 1:2 stock split, ex-date: 02 Apr 26

R&B Denims Ltd has announced 1:2 bonus issue, ex-date: 02 Apr 26

No Rights history available
Quality key factors
Valuation key factors
Technicals key factors
 Technical Indicator Scale: Bearish, Mildly Bearish, Sideways, Mildly Bullish, Bullish Turned
 Shareholding Snapshot : Apr 2026
Shareholding Compare (%holding)
Promoters
None
Held by 0 Schemes
Held by 5 FIIs (2.07%)
Rajkumar Mangilal Borana (11.41%)
Goenka Business And Finance Limited (2.51%)
33.56%
Quarterly Results Snapshot (Consolidated) - Mar'26 - YoY

YoY Growth in quarter ended Mar 2026 is 37.94% vs -19.01% in Mar 2025

YoY Growth in quarter ended Mar 2026 is -85.28% vs 2.56% in Mar 2025
Half Yearly Results Snapshot (Consolidated) - Sep'25
Growth in half year ended Sep 2025 is 25.33% vs 45.11% in Sep 2024
Growth in half year ended Sep 2025 is 57.22% vs 12.43% in Sep 2024
Nine Monthly Results Snapshot (Consolidated) - Dec'25
YoY Growth in nine months ended Dec 2025 is 22.95% vs 18.22% in Dec 2024
YoY Growth in nine months ended Dec 2025 is 19.02% vs 36.56% in Dec 2024
Annual Results Snapshot (Consolidated) - Mar'26
YoY Growth in year ended Mar 2026 is 27.03% vs 5.08% in Mar 2025
YoY Growth in year ended Mar 2026 is -9.87% vs 24.98% in Mar 2025
About R&B Denims Ltd

Company Coordinates


