
Compare Radhika Jeweltec with Similar Stocks
Stock DNA
Gems, Jewellery And Watches
INR 654 Cr (Micro Cap)
9.00
48
0.00%
0.12
23.18%
2.03
Total Returns (Price + Dividend) 
Latest dividend: 0.2 per share ex-dividend date: Sep-13-2022
Risk Adjusted Returns v/s
Returns Beta

News
Radhika Jeweltech Ltd is Rated Sell
Radhika Jeweltech Ltd is rated Sell by MarketsMOJO, with this rating last updated on 20 May 2026. However, the analysis and financial metrics presented here reflect the stock’s current position as of 21 June 2026, providing investors with the most recent and relevant data to assess the company’s outlook.
Read full news article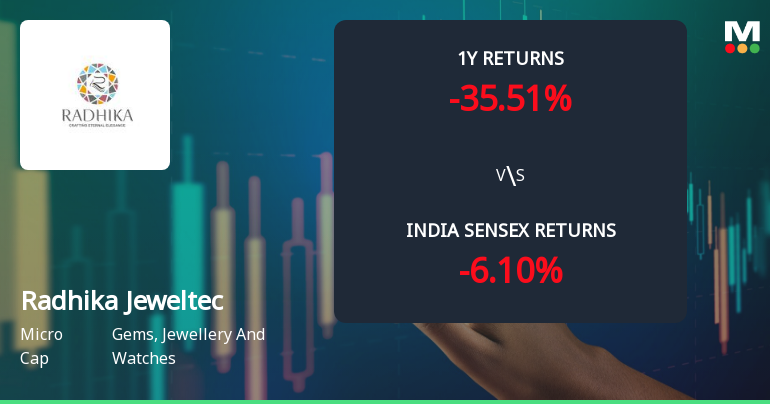
Radhika Jeweltech Ltd Faces Bearish Momentum Amid Technical Downgrade
Radhika Jeweltech Ltd has experienced a notable shift in its technical momentum, with key indicators signalling a transition from mildly bearish to bearish trends. The company’s micro-cap status and recent downgrade from Hold to Sell by MarketsMOJO reflect growing concerns amid a challenging price environment and subdued relative performance against the Sensex.
Read full news article
Radhika Jeweltech Ltd Sees Mixed Technical Signals Amid Price Momentum Shift
Radhika Jeweltech Ltd, a micro-cap player in the Gems, Jewellery and Watches sector, has experienced a notable shift in its technical parameters, reflecting a complex interplay of bullish and bearish signals. Despite a recent 3.83% gain in the stock price to ₹58.79, the company’s overall momentum and technical indicators present a nuanced picture for investors navigating the current market environment.
Read full news article Announcements
Corporate Actions

No Upcoming Board Meetings

Radhika Jeweltech Ltd has declared 10% dividend, ex-date: 13 Sep 22

Radhika Jeweltech Ltd has announced 2:10 stock split, ex-date: 26 May 23

No Bonus history available

No Rights history available
Quality key factors
Valuation key factors
Technicals key factors
 Technical Indicator Scale: Bearish, Mildly Bearish, Sideways, Mildly Bullish, Bullish Turned
 Shareholding Snapshot : Mar 2026
Shareholding Compare (%holding)
Promoters
None
Held by 0 Schemes
Held by 3 FIIs (0.13%)
Ashokkumar Mathurdas Zinzuwadia (22.33%)
Jenil Hareshkumar Zinzuwadia (7.06%)
22.48%
Quarterly Results Snapshot (Standalone) - Mar'26 - YoY

YoY Growth in quarter ended Mar 2026 is 23.54% vs 1.90% in Mar 2025

YoY Growth in quarter ended Mar 2026 is -32.35% vs -2.88% in Mar 2025
Half Yearly Results Snapshot (Standalone) - Sep'25
Growth in half year ended Sep 2025 is 3.09% vs 4.90% in Sep 2024
Growth in half year ended Sep 2025 is 54.71% vs 5.72% in Sep 2024
Nine Monthly Results Snapshot (Standalone) - Dec'25
YoY Growth in nine months ended Dec 2025 is 3.36% vs 10.45% in Dec 2024
YoY Growth in nine months ended Dec 2025 is 44.96% vs 21.91% in Dec 2024
Annual Results Snapshot (Standalone) - Mar'26
YoY Growth in year ended Mar 2026 is 8.74% vs 8.04% in Mar 2025
YoY Growth in year ended Mar 2026 is 24.40% vs 21.38% in Mar 2025
About Radhika Jeweltech Ltd

Company Coordinates


