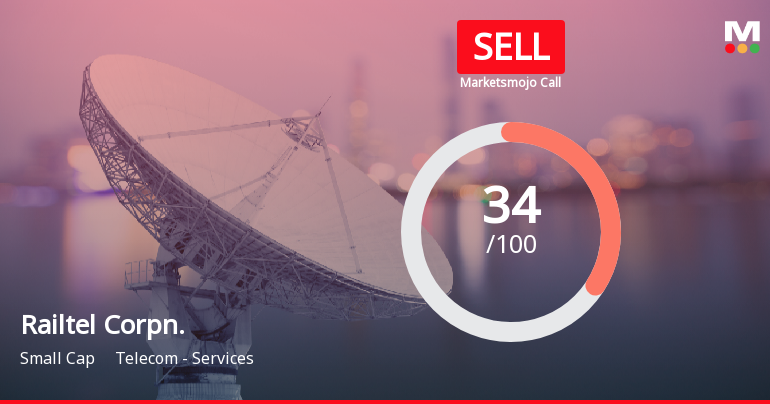
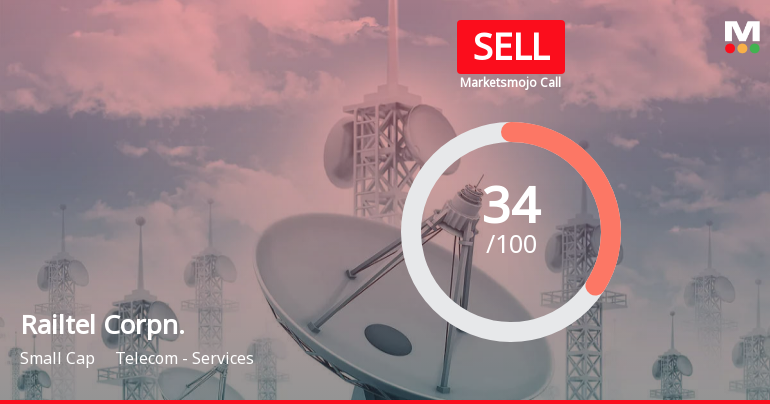
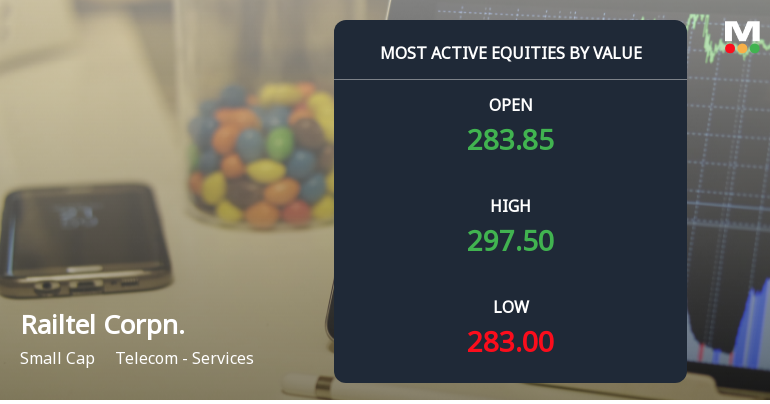
Railtel Corpn.

  • Market Cap: Small Cap
  • Industry: Telecom - Services
  • ISIN: INE0DD101019
  • NSEID: RAILTEL
  • BSEID: 543265
INR
259.90
-2.8 (-1.07%)
BSENSE

Sep 11, 03:30 PM

BSE+NSE Vol: 4.72 lacs

  • Price Points
  • Score
  • Mojo Parameters
  • Total Return
  • News and Corporate Actions
  • Key factors
  • Shareholding
  • Financials
  • CompanyCV
stock-summaryPrice Point
High/Low

1Day

52 Week

Valuation
Technical
Day's Volume

CASH

4.72 lacs (-7.66%) Volume

Shareholding (Jun 2026)

FII

3.98%

Held by 106 FIIs

DII

0.99%

Held by 9 DIIs

Promoter

72.84%

Why is Railtel Corporation of India Ltd falling/rising?

06-Sep-2026

As of 05-Sep, Railtel Corporation of India Ltd's stock price is slightly rising at 271.15, but it has underperformed its sector and shows ongoing weakness with significant declines year-to-date and over the past week. Despite being net-debt free, disappointing quarterly results and falling investor interest indicate the stock remains under pressure.

As of 05-Sep, Railtel Corporation of India Ltd's stock price is experiencing a slight rise, currently at 271.15, with a change of 0.15 (0.06%) upward. This increase comes after two consecutive days of decline, indicating a potential trend reversal. However, despite this minor uptick, the stock has underperformed its sector by 1.02% today and is trading below its 5-day, 20-day, 50-day, 100-day, and 200-day moving averages, suggesting ongoing weakness in its price performance.<BR><BR>Over the past week, the stock has decreased by 2.76%, and it has shown a significant decline of 27.02% year-to-date, which is considerably worse than the Sensex's decline of 10.21% in the same period. Additionally, the stock's performance over the last year has been poor, with a return of -21.22%, again underperforming the broader market indices.<BR><BR>Investor participation appears to be falling, as evidenced by a 15.57% drop in delivery volume compared to the 5-day average. This decline in trading activity could indicate a lack of confidence among investors. Furthermore, while the company is net-debt free and has shown healthy long-term growth in net sales, the recent quarterly results have been disappointing, with significant declines in profit before tax, profit after tax, and net sales compared to previous quarters.<BR><BR>Overall, while there is a slight rise in the stock price today, the broader context of underperformance, declining investor interest, and disappointing financial results suggests that the stock remains under pressure.

View full answer

Who are in the management team of Railtel Corpn.?

01-Sep-2026

The management team of Railtel Corporation includes Sanjai Kumar (Chairman & Managing Director), Rakesh Ranjan and Rameshwer Meena (Government nominees), Subhash Sharma and N. Manoharan (Independent Directors), RAMA MANOHARA VIPPAGUNTA (Director of Finance & CFO), Manoj Tandon (Director of Operations & Projects), and Yaspal Singh Tomar (Director of Marketing). They oversee the company's operations and strategic direction.

The management team of Railtel Corporation includes the following members:<BR><BR>1. **Sanjai Kumar** - Chairman & Managing Director<BR>2. **Rakesh Ranjan** - Nominee from the Government of India<BR>3. **Subhash Sharma** - Independent Director<BR>4. **N. Manoharan** - Independent Director<BR>5. **RAMA MANOHARA VIPPAGUNTA** - Director (Finance) & CFO<BR>6. **Manoj Tandon** - Director (Operations & Projects)<BR>7. **Yaspal Singh Tomar** - Director (Marketing)<BR>8. **Rameshwer Meena** - Nominee from the Government of India<BR><BR>This team is responsible for overseeing the operations and strategic direction of the company.

View full answer

What does Railtel Corpn. do?

01-Sep-2026

Railtel Corporation of India Ltd is a Public Sector Undertaking that modernizes railway communication assets for operational and commercial use. As of June 2026, it reported net sales of 893 Cr and a net profit of 66 Cr, with a market cap of INR 8,853 Cr.

Overview: <BR>Railtel Corporation of India Ltd is a Public Sector Undertaking in the Telecom - Services industry, focused on utilizing and modernizing railway communication assets for both railway operations and commercial purposes.<BR><BR>History: <BR>Railtel Corporation of India Ltd was established in September 2000 and is a 100% subsidiary of the Ministry of Railways. The latest quarterly results reported net sales and net profit for June 2026.<BR><BR>Financial Snapshot: <BR>Most recent Net Sales: 893 Cr (Quarterly Results - Jun 2026) <BR>Most recent Net Profit: 66 Cr (Quarterly Results - Jun 2026) <BR>Market-cap value: INR 8,853 Cr (Small Cap)<BR><BR>Key Metrics: <BR>P/E: 47.00 <BR>Industry P/E: 20 <BR>Dividend Yield: 1.15% <BR>Debt-Equity: -0.26 <BR>Return on Equity: 16.42% <BR>Price to Book: 3.95<BR><BR>Contact Details: <BR>No Company Details Available <BR>Registrar Address: Not available.

View full answer

Who are the peers of the Railtel Corpn.?

01-Sep-2026

Railtel Corpn.'s peers include Bharti Airtel, Vodafone Idea, Tata Comm, and Route Mobile, among others. In terms of management risk, Railtel has an average rating, with good growth prospects and a 1-year return of -16.00%.

Peers: The peers of Railtel Corpn. are Bharti Airtel, Vodafone Idea, Bharti Hexacom, Tata Comm, Tata Tele. Mah., Route Mobile, M T N L, STL Networks, and Reliance Communi.<BR><BR>Quality Snapshot: Excellent management risk is observed at Bharti Airtel, Bharti Hexacom, and Tata Comm, while Average management risk is found at Vodafone Idea, Railtel Corpn., Route Mobile, and Sar Televenture. Below Average management risk is noted for STL Networks, while Tata Tele. Mah., M T N L, and Reliance Communi do not qualify. Growth is Excellent for Bharti Airtel, Bharti Hexacom, and Sar Televenture, while Good growth is seen at Railtel Corpn. and Route Mobile. Below Average growth is present at Vodafone Idea, Tata Comm, and STL Networks, and the rest do not qualify. Capital Structure is Excellent for Railtel Corpn. and Route Mobile, Average for Bharti Hexacom, and Below Average for Bharti Airtel, Vodafone Idea, Tata Comm, and STL Networks, while Tata Tele. Mah., M T N L, and Reliance Communi do not qualify.<BR><BR>Return Snapshot: Vodafone Idea has the highest 1-year return at 124.65%, while Route Mobile has the lowest at -41.03%. Railtel Corpn.'s 1-year return is -16.00%, which is significantly lower than Vodafone Idea's return and higher than Route Mobile's. Additionally, the six-month return is negative for Bharti Airtel, Bharti Hexacom, Tata Comm, Tata Tele. Mah., Route Mobile, M T N L, and Reliance Communi.

View full answer

How big is Railtel Corpn.?

01-Sep-2026

As of 31st August, Railtel Corporation of India Ltd has a market capitalization of 8,853.00 Cr, with recent net sales of 2,224.71 Cr and a net profit of 214.53 Cr. Shareholder's funds are 1,648.88 Cr, and total assets amount to 3,307.94 Cr as of March 2023.

As of 31st August, Railtel Corporation of India Ltd has a market capitalization of 8,853.00 Cr, categorizing it as a Small Cap company.<BR><BR>In the latest four quarters, Railtel reported Net Sales of 2,224.71 Cr and a Net Profit of 214.53 Cr.<BR><BR>The latest annual period for the balance sheet is March 2023, with Shareholder's Funds amounting to 1,648.88 Cr and Total Assets of 3,307.94 Cr.

View full answer

Should I buy, sell or hold Railtel Corporation of India Ltd?

31-Jul-2026

When is the next results date for Railtel Corporation of India Ltd?

28-Apr-2026

The next results date for Railtel Corporation of India Ltd is April 30, 2026.

The next results date for Railtel Corporation of India Ltd is scheduled for April 30, 2026.

View full answer

Has Railtel Corporation of India Ltd declared dividend?

10-Mar-2026

Railtel Corporation of India Ltd has declared a 10% dividend, with an ex-date of March 13, 2026, and a dividend yield of 0.99%. While recent total returns have been negative in the short term, the company has shown strong positive returns over longer periods.

Railtel Corporation of India Ltd has declared a 10% dividend.<BR><BR>Dividend Details:<BR>- Percentage announced: 10%<BR>- Ex-date: 13 Mar 26<BR><BR>Dividend Yield: 0.99%.<BR><BR>Total Returns by Period:<BR>In the last 3 months, the price return was -9.53%, the dividend return was 0%, resulting in a total return of -9.53%.<BR><BR>Over the last 6 months, the price return was -21.07%, the dividend return was 0%, leading to a total return of -21.07%.<BR><BR>For the past year, the price return was -0.81%, with a dividend return of 0%, resulting in a total return of -0.81%.<BR><BR>In the last 2 years, the price return was -31.52%, the dividend return was 0%, which resulted in a total return of -31.52%.<BR><BR>Over the last 3 years, the price return was 165.53%, the dividend return was 0%, leading to a total return of 165.53%.<BR><BR>In the last 4 years, the price return was 216.16%, with a dividend return of 0%, resulting in a total return of 216.16%.<BR><BR>For the past 5 years, the price return was 94.47%, the dividend return was 0%, leading to a total return of 94.47%.<BR><BR>Overall, while Railtel Corporation of India Ltd has declared a dividend, the total returns over various periods show significant fluctuations, with negative returns in the short term but strong positive returns over longer periods. The dividend yield remains relatively low at 0.99%.

View full answer

Are Railtel Corporation of India Ltd latest results good or bad?

03-Feb-2026

Railtel Corporation of India Ltd's latest results show strong net profit growth of 80.01% and a 20.26% revenue increase, but declining operating margins and significant stock underperformance raise concerns about sustainability. Investors should proceed with caution until margin recovery is evident.

Railtel Corporation of India Ltd's latest results present a mixed picture. On one hand, the company reported a significant quarter-on-quarter increase in net profit for Q2 FY24, rising by 80.01% to ₹69.14 crore, and revenue growth of 20.26% year-on-year for the first nine months of FY26. This indicates that Railtel is managing to capture market share in the growing digital infrastructure sector.<BR><BR>However, there are notable concerns as well. The operating margin has contracted to 19.24%, down from 23.41% a year ago, reflecting pressure from increasing competition and potential cost escalations. Additionally, the stock has underperformed significantly over the past year, declining by 11.17%, while the Sensex has gained 5.37%. This underperformance, combined with the decline in margins, raises questions about the sustainability of the company's growth.<BR><BR>Overall, while there are positive signs in terms of revenue and profit growth, the ongoing margin compression and competitive pressures suggest that the results are not entirely favorable. Investors may want to approach with caution until there are clearer signs of margin recovery and consistent operational performance.

View full answer

Is Railtel Corpn. technically bullish or bearish?

02-Dec-2025

As of December 1, 2025, the technical trend for Railtel Corpn has shifted to mildly bearish, primarily due to bearish signals from the weekly MACD and KST indicators, despite some mildly bullish daily moving averages.

As of 1 December 2025, the technical trend has changed from mildly bullish to mildly bearish. The current stance is mildly bearish, driven primarily by the weekly MACD and KST indicators, both of which are bearish. The Bollinger Bands also confirm a bearish outlook on both weekly and monthly time frames. While the daily moving averages show a mildly bullish signal, this is overshadowed by the overall bearish indicators in the longer time frames. The RSI shows no signal, indicating a lack of momentum in either direction. Overall, the technical indicators suggest a cautious stance on Railtel Corpn.

View full answer

How has been the historical performance of Railtel Corpn.?

01-Dec-2025

Railtel Corpn. has demonstrated consistent growth in net sales and total operating income, reaching 1,963.51 Cr in Mar'23, while operating profit increased to 417.18 Cr. However, profit before tax peaked at 280.62 Cr in Mar'22 before declining to 254.79 Cr in Mar'23, and the company faced cash management challenges with a net cash outflow of 62.00 Cr in the same year.

Answer:<BR>The historical performance of Railtel Corpn. shows a consistent growth trajectory in net sales and total operating income over the years, with net sales increasing from 1,003.27 Cr in Mar'19 to 1,963.51 Cr in Mar'23. Total operating income followed a similar trend, rising from 976.78 Cr in Mar'18 to 1,963.51 Cr in Mar'23. Operating profit (PBDIT) also demonstrated growth, reaching 417.18 Cr in Mar'23, up from 311.43 Cr in Mar'17. However, profit before tax saw fluctuations, peaking at 280.62 Cr in Mar'22 before declining to 254.79 Cr in Mar'23. Profit after tax mirrored this trend, decreasing from 208.95 Cr in Mar'22 to 189.08 Cr in Mar'23. The company's total assets increased significantly from 2,318.88 Cr in Mar'18 to 3,307.94 Cr in Mar'23, while total liabilities also rose from 2,227.68 Cr to 3,307.94 Cr in the same period. Cash flow from operating activities peaked at 263.00 Cr in Mar'22 but showed a net cash outflow of 62.00 Cr in the same year.<BR><BR>Breakdown:<BR>Railtel Corpn. has shown a robust increase in net sales, which rose from 1,003.27 Cr in Mar'19 to 1,963.51 Cr in Mar'23, indicating strong revenue growth. Total operating income mirrored this growth, reaching 1,963.51 Cr in Mar'23. Operating profit (PBDIT) also increased, reaching 417.18 Cr in Mar'23, although profit before tax peaked in Mar'22 at 280.62 Cr before declining to 254.79 Cr in Mar'23. Profit after tax followed a similar pattern, decreasing from 208.95 Cr in Mar'22 to 189.08 Cr in Mar'23. The company's total assets grew significantly from 2,318.88 Cr in Mar'18 to 3,307.94 Cr in Mar'23, while total liabilities increased correspondingly from 2,227.68 Cr to 3,307.94 Cr. Cash flow from operating activities was strong at 263.00 Cr in Mar'22, but the company experienced a net cash outflow of 62.00 Cr in the same year, reflecting challenges in cash management despite overall growth in sales and assets.

View full answer

Is Railtel Corpn. overvalued or undervalued?

20-Nov-2025

As of November 19, 2025, Railtel Corporation is fairly valued with a PE ratio of 34.88 and an EV to EBITDA of 19.26, but has underperformed the Sensex with a year-to-date return of -13.25%.

As of 19 November 2025, Railtel Corpn. has moved from an expensive to a fair valuation grade. The company is currently fairly valued, with a PE ratio of 34.88, an EV to EBITDA of 19.26, and a PEG ratio of 2.49. In comparison, Indus Towers, which is considered expensive, has a PE ratio of 11.64 and an EV to EBITDA of 6.17, while Affle 3i is classified as very expensive with a PE ratio of 56.6 and an EV to EBITDA of 41.20.<BR><BR>Despite the fair valuation, Railtel's stock has underperformed relative to the Sensex, with a year-to-date return of -13.25% compared to the Sensex's 9.02%. This performance, alongside its current ratios, suggests that while Railtel Corpn. is not overvalued, it may face challenges in the near term, particularly in light of its recent stock performance against broader market trends.

View full answer

Who are the top shareholders of the Railtel Corpn.?

17-Jul-2025

The top shareholder of Railtel Corporation is the President of India, holding 72.84% of the shares. Other shareholders include 13 mutual fund schemes (0.12%), 78 foreign institutional investors (3.33%), and individual investors (21.25%).

The top shareholders of Railtel Corporation include the President of India, who holds the largest stake at 72.84%. The company also has a diverse range of shareholders, including 13 mutual fund schemes that collectively hold 0.12% and 78 foreign institutional investors (FIIs) with a combined holding of 3.33%. Additionally, individual investors own 21.25% of the shares. There are no pledged promoter holdings, and there are no significant public shareholders listed.

View full answer
iScoreScore
Click here to find our call on this stock
Strong Sell
Sell
Hold
Buy
Strong Buy

Dashboard

1

Flat results in Jun 26

  • PBT LESS OI(Q) At Rs 80.15 cr has Fallen at -27.8% (vs previous 4Q average)
  • PAT(Q) At Rs 70.96 cr has Fallen at -22.0% (vs previous 4Q average)
  • NET SALES(Q) At Rs 893.27 cr has Fallen at -16.5% (vs previous 4Q average)
2

Despite the size of the company, domestic mutual funds hold only 1.06% of the company

3

Below par performance in long term as well as near term

stock-summaryMojo Parameters

Mojo Parameters

Loading Valuation Snapshot...

Stock DNA

stock-summary
Industry

Telecom - Services

stock-summary
Market cap

INR 8,266 Cr (Small Cap)

stock-summary
P/E

45.00

stock-summary
Industry P/E

20

stock-summary
Dividend Yield

1.22%

stock-summary
Debt Equity

-0.26

stock-summary
Return on Equity

16.42%

stock-summary
Price to Book

3.73

Revenue and Profits:
Net Sales:
893 Cr
(Quarterly Results - Jun 2026)
Net Profit:
66 Cr
stock-summaryTotal Returns
Total Returns (Price + Dividend) stock-summary
Dividend Yield (1.22%)
TimePeriod
Price Return
Dividend Return
Total Return
3 Months
-11.75%
0%
-11.75%
6 Months
-8.32%
0%
-8.32%
1 Year
-28.48%
0%
-28.48%
2 Years
-44.23%
0%
-44.23%
3 Years
4.67%
0%
4.67%
4 Years
142.44%
0%
142.44%
5 Years
99.62%
0%
99.62%

Railtel Corpn. for the last several years.

Risk Adjusted Returns v/s stock-summary
Returns Beta
Icon
Beta has not been calculated since enough price history is not available
stock-summaryNews & Corporate Actions

Announcements stock-summary

Icon
No announcement available

Corporate Actions stock-summary

stock-summary
BOARD MEETING

No Upcoming Board Meetings

stock-summary
DIVIDEND

Railtel Corporation of India Ltd has declared 12% dividend, ex-date: 13 Aug 26

stock-summary
SPLITS

No Splits history available

stock-summary
BONUS

No Bonus history available

stock-summary
RIGHTS

No Rights history available

stock-summaryKey Factors

Quality key factors stock-summary

Factor
Value
Sales Growth (5y)
26.00%
EBIT Growth (5y)
21.64%
EBIT to Interest (avg)
80.14
Debt to EBITDA (avg)
0.11
Net Debt to Equity (avg)
-0.26
Sales to Capital Employed (avg)
1.51
Tax Ratio
26.34%
Dividend Payout Ratio
30.51%
Pledged Shares
0
Institutional Holding
4.97%
ROCE (avg)
20.48%
ROE (avg)
13.85%

Valuation key factors

Factor
Value
P/E Ratio
45
Industry P/E
20
Price to Book Value
3.70
EV to EBIT
17.05
EV to EBITDA
11.94
EV to Capital Employed
4.66
EV to Sales
1.76
PEG Ratio
1.35
Dividend Yield
1.23%
ROCE (Latest)
26.78%
ROE (Latest)
16.42%

Technicals key factors

Indicator
Weekly
Monthly
MACD
Bearish
Bearish
RSI
No Signal
No Signal
Bollinger Bands
Bearish
Bearish
Moving Averages
Bearish (Daily)
KST
Bearish
Bearish
Dow Theory
Mildly Bearish
Mildly Bearish
OBV
Mildly Bearish
No Trend
stock-summary Technical Indicator Scale: Bearish, Mildly Bearish, Sideways, Mildly Bullish, Bullish  Turned 
stock-summaryShareholding
Shareholding Snapshot : Jun 2026stock-summary
Shareholding Compare (%holding) stock-summary
Majority shareholders

Promoters

Pledged Promoter Holdings

None

Mutual Funds

Held by 18 Schemes (0.29%)

FIIs

Held by 106 FIIs (3.98%)

Promoter with highest holding

President Of India (72.84%)

Highest Public shareholder

None

Individual Investors Holdings

20.26%

stock-summaryFinancial
[
  {
    "link": "quarterly",
    "btn_text": "All Quarterly Results",
    "header": "Quarterly Results Snapshot (Standalone) - Jun'26 - QoQ",
    "rhs": [
      {
        "prefix": "Net Sales ",
        "suffix": "QoQ Growth in quarter ended Jun 2026 is -46.47% vs 82.70% in Mar 2026",
        "dir": -1
      },
      {
        "prefix": "Standalone Net Profit ",
        "suffix": "QoQ Growth in quarter ended Jun 2026 is -53.59% vs 127.16% in Mar 2026",
        "dir": -1
      }
    ],
    "table": {
      "header": [
        "Jun'26",
        "Mar'26",
        "Change(%)"
      ],
      "body": [
        {
          "field": "Net Sales",
          "val1": "893.27",
          "val2": "1,668.86",
          "chgp": "-46.47%",
          "chgp_class": "negative"
        },
        {
          "field": "Operating Profit (PBDIT) excl Other Income",
          "val1": "131.57",
          "val2": "232.70",
          "chgp": "-43.46%",
          "chgp_class": "negative"
        },
        {
          "field": "Interest",
          "val1": "1.03",
          "val2": "1.71",
          "chgp": "-39.77%",
          "chgp_class": "positive"
        },
        {
          "field": "Exceptional Items",
          "val1": "-7.04",
          "val2": "-2.47",
          "chgp": "-185.02%",
          "chgp_class": "negative"
        },
        {
          "field": "Standalone Net Profit",
          "val1": "65.78",
          "val2": "141.75",
          "chgp": "-53.59%",
          "chgp_class": "negative"
        },
        {
          "field": "Operating Profit Margin (Excl OI)",
          "val1": "14.73%",
          "val2": "13.94%",
          "chgp": "0.79%",
          "chgp_class": "positive"
        }
      ]
    }
  },
  {
    "link": "half-yearly",
    "btn_text": "All Half Yearly Results",
    "header": "Half Yearly Results Snapshot (Standalone) - Sep'25",
    "rhs": [
      {
        "prefix": "Net Sales ",
        "suffix": " Growth in half year ended Sep 2025 is 20.95% vs 31.39% in Sep 2024",
        "dir": -1
      },
      {
        "prefix": "Standalone Net Profit ",
        "suffix": " Growth in half year ended Sep 2025 is 17.20% vs 13.86% in Sep 2024",
        "dir": 1
      }
    ],
    "table": {
      "header": [
        "Sep'25",
        "Sep'24",
        "Change(%)"
      ],
      "body": [
        {
          "field": "Net Sales",
          "val1": "1,695.17",
          "val2": "1,401.60",
          "chgp": "20.95%",
          "chgp_class": "positive"
        },
        {
          "field": "Operating Profit (PBDIT) excl Other Income",
          "val1": "270.33",
          "val2": "232.69",
          "chgp": "16.18%",
          "chgp_class": "positive"
        },
        {
          "field": "Interest",
          "val1": "1.14",
          "val2": "1.52",
          "chgp": "-25.00%",
          "chgp_class": "positive"
        },
        {
          "field": "Exceptional Items",
          "val1": "-12.71",
          "val2": "-31.30",
          "chgp": "59.39%",
          "chgp_class": "positive"
        },
        {
          "field": "Standalone Net Profit",
          "val1": "142.17",
          "val2": "121.31",
          "chgp": "17.20%",
          "chgp_class": "positive"
        },
        {
          "field": "Operating Profit Margin (Excl OI)",
          "val1": "15.95%",
          "val2": "16.60%",
          "chgp": "-0.65%",
          "chgp_class": "negative"
        }
      ]
    }
  },
  {
    "link": "nine-monthly",
    "btn_text": "All Nine Monthly Results",
    "header": "Nine Monthly Results Snapshot (Standalone) - Dec'25",
    "rhs": [
      {
        "prefix": "Net Sales ",
        "suffix": "YoY Growth in nine months ended Dec 2025 is 20.26% vs 25.02% in Dec 2024",
        "dir": -1
      },
      {
        "prefix": "Standalone Net Profit ",
        "suffix": "YoY Growth in nine months ended Dec 2025 is 9.77% vs 10.48% in Dec 2024",
        "dir": -1
      }
    ],
    "table": {
      "header": [
        "Dec'25",
        "Dec'24",
        "Change(%)"
      ],
      "body": [
        {
          "field": "Net Sales",
          "val1": "2,608.62",
          "val2": "2,169.22",
          "chgp": "20.26%",
          "chgp_class": "positive"
        },
        {
          "field": "Operating Profit (PBDIT) excl Other Income",
          "val1": "403.76",
          "val2": "353.84",
          "chgp": "14.11%",
          "chgp_class": "positive"
        },
        {
          "field": "Interest",
          "val1": "2.07",
          "val2": "2.08",
          "chgp": "-0.48%",
          "chgp_class": "positive"
        },
        {
          "field": "Exceptional Items",
          "val1": "-21.89",
          "val2": "-33.66",
          "chgp": "34.97%",
          "chgp_class": "positive"
        },
        {
          "field": "Standalone Net Profit",
          "val1": "204.57",
          "val2": "186.36",
          "chgp": "9.77%",
          "chgp_class": "positive"
        },
        {
          "field": "Operating Profit Margin (Excl OI)",
          "val1": "15.48%",
          "val2": "16.31%",
          "chgp": "-0.83%",
          "chgp_class": "negative"
        }
      ]
    }
  },
  {
    "link": "annual",
    "btn_text": "All Annual Results",
    "header": "Annual Results Snapshot (Standalone) - Mar'26",
    "rhs": [
      {
        "prefix": "Net Sales ",
        "suffix": "YoY Growth in year ended Mar 2026 is 23.00% vs 35.43% in Mar 2025",
        "dir": -1
      },
      {
        "prefix": "Standalone Net Profit ",
        "suffix": "YoY Growth in year ended Mar 2026 is 15.51% vs 21.77% in Mar 2025",
        "dir": -1
      }
    ],
    "table": {
      "header": [
        "Mar'26",
        "Mar'25",
        "Change(%)"
      ],
      "body": [
        {
          "field": "Net Sales",
          "val1": "4,277.48",
          "val2": "3,477.50",
          "chgp": "23.00%",
          "chgp_class": "positive"
        },
        {
          "field": "Operating Profit (PBDIT) excl Other Income",
          "val1": "636.46",
          "val2": "533.47",
          "chgp": "19.31%",
          "chgp_class": "positive"
        },
        {
          "field": "Interest",
          "val1": "3.78",
          "val2": "3.11",
          "chgp": "21.54%",
          "chgp_class": "negative"
        },
        {
          "field": "Exceptional Items",
          "val1": "-24.36",
          "val2": "-21.72",
          "chgp": "-12.15%",
          "chgp_class": "negative"
        },
        {
          "field": "Standalone Net Profit",
          "val1": "346.32",
          "val2": "299.81",
          "chgp": "15.51%",
          "chgp_class": "positive"
        },
        {
          "field": "Operating Profit Margin (Excl OI)",
          "val1": "14.88%",
          "val2": "15.34%",
          "chgp": "-0.46%",
          "chgp_class": "negative"
        }
      ]
    }
  }
]

Quarterly Results Snapshot (Standalone) - Jun'26 - QoQstock-summary

Jun'26
Mar'26
Change(%)
Net Sales
893.27
1,668.86
-46.47%
Operating Profit (PBDIT) excl Other Income
131.57
232.70
-43.46%
Interest
1.03
1.71
-39.77%
Exceptional Items
-7.04
-2.47
-185.02%
Standalone Net Profit
65.78
141.75
-53.59%
Operating Profit Margin (Excl OI)
14.73%
13.94%
0.79%
Values in Rs Cr.
Direction Arrows
Net Sales

QoQ Growth in quarter ended Jun 2026 is -46.47% vs 82.70% in Mar 2026

Direction Arrows
Standalone Net Profit

QoQ Growth in quarter ended Jun 2026 is -53.59% vs 127.16% in Mar 2026

Half Yearly Results Snapshot (Standalone) - Sep'25stock-summary

Sep'25
Sep'24
Change(%)
Net Sales
1,695.17
1,401.60
20.95%
Operating Profit (PBDIT) excl Other Income
270.33
232.69
16.18%
Interest
1.14
1.52
-25.00%
Exceptional Items
-12.71
-31.30
59.39%
Standalone Net Profit
142.17
121.31
17.20%
Operating Profit Margin (Excl OI)
15.95%
16.60%
-0.65%
Values in Rs Cr.
Direction Arrows
Net Sales

Growth in half year ended Sep 2025 is 20.95% vs 31.39% in Sep 2024

Direction Arrows
Standalone Net Profit

Growth in half year ended Sep 2025 is 17.20% vs 13.86% in Sep 2024

Nine Monthly Results Snapshot (Standalone) - Dec'25stock-summary

Dec'25
Dec'24
Change(%)
Net Sales
2,608.62
2,169.22
20.26%
Operating Profit (PBDIT) excl Other Income
403.76
353.84
14.11%
Interest
2.07
2.08
-0.48%
Exceptional Items
-21.89
-33.66
34.97%
Standalone Net Profit
204.57
186.36
9.77%
Operating Profit Margin (Excl OI)
15.48%
16.31%
-0.83%
Values in Rs Cr.
Direction Arrows
Net Sales

YoY Growth in nine months ended Dec 2025 is 20.26% vs 25.02% in Dec 2024

Direction Arrows
Standalone Net Profit

YoY Growth in nine months ended Dec 2025 is 9.77% vs 10.48% in Dec 2024

Annual Results Snapshot (Standalone) - Mar'26stock-summary

Mar'26
Mar'25
Change(%)
Net Sales
4,277.48
3,477.50
23.00%
Operating Profit (PBDIT) excl Other Income
636.46
533.47
19.31%
Interest
3.78
3.11
21.54%
Exceptional Items
-24.36
-21.72
-12.15%
Standalone Net Profit
346.32
299.81
15.51%
Operating Profit Margin (Excl OI)
14.88%
15.34%
-0.46%
Values in Rs Cr.
Direction Arrows
Net Sales

YoY Growth in year ended Mar 2026 is 23.00% vs 35.43% in Mar 2025

Direction Arrows
Standalone Net Profit

YoY Growth in year ended Mar 2026 is 15.51% vs 21.77% in Mar 2025

stock-summaryCompany CV
About Railtel Corporation of India Ltd stock-summary
stock-summary
Railtel Corporation of India Ltd
Small Cap
Telecom - Services
Railtel Corporation of India Ltd (RCIL) was established in September 2000 as a Public Sector Undertaking. The Company is promoted by and is in administrative control of Ministry of Railways. It is a 100% subsidiary of Ministry of Railways. It was set up mainly to utilise the Railway's communication assets lying idely and to modernize the existing infrastructure for providing communication facilities for Railways and for commercial purposes.
Company Coordinates stock-summary
Icon
No Company Details Available