
Compare Raj Rayon Inds. with Similar Stocks
Dashboard
Weak Long Term Fundamental Strength with an average Return on Capital Employed (ROCE) of 4.96%
- Low ability to service debt as the company has a high Debt to EBITDA ratio of 3.49 times
Despite the size of the company, domestic mutual funds hold only 0% of the company
Below par performance in long term as well as near term
Stock DNA
Garments & Apparels
INR 1,112 Cr (Micro Cap)
33.00
23
0.00%
1.12
21.72%
7.25
Total Returns (Price + Dividend) 
Latest dividend: 0.3 per share ex-dividend date: Sep-06-2011
Risk Adjusted Returns v/s
Returns Beta

News

Raj Rayon Industries Ltd Locks at Upper Circuit With 1.84% Gain — Buyers Queue, Sellers Absent
At Rs 20.55, the buying was done — not because demand dried up, but because the exchange wouldn't let the stock go any higher. Raj Rayon Industries Ltd locked at its upper circuit of 1.84% on 11 Jun 2026, with buyers queuing and no sellers willing to part with shares.
Read full news article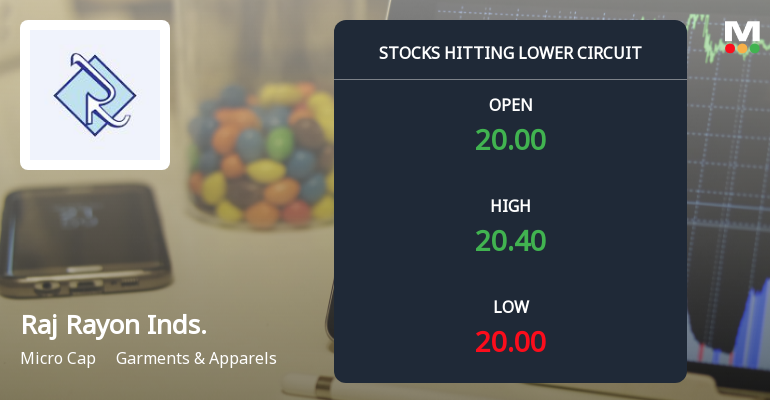
Raj Rayon Industries Ltd Locks at Lower Circuit With 2.0% Loss — Sellers Queue, No Buyers in Sight
At Rs 19.97, sellers were still queuing — but there were no buyers willing to take the other side. Raj Rayon Industries Ltd locked at its lower circuit of 2.0% on 10 Jun 2026, with unfilled sell orders and a frozen price, reflecting persistent selling pressure in a micro-cap stock with limited liquidity.
Read full news article
Raj Rayon Industries Ltd Locks at Upper Circuit With 1.97% Gain — Buyers Queue, Sellers Absent
At Rs 20.66, the buying was done — not because demand dried up, but because the exchange wouldn't let the stock go any higher. Raj Rayon Industries Ltd locked at its upper circuit of 1.97% on 9 Jun 2026, with buyers queuing and no sellers willing to part with shares.
Read full news article Announcements
Corporate Presentation
18-May-2026 | Source : BSECorporate Presentation
Announcement under Regulation 30 (LODR)-Newspaper Publication
15-May-2026 | Source : BSENewspaper publication for Audited results for the quarter and year ended 31.03.2026
Board Meeting Outcome for Outcome Of The Board Meeting Held On May 14 2026
14-May-2026 | Source : BSE1. Approved and taken on record the audited Financial Results of the Company for the last quarter & year ended March 31 2026 2. Resignation of Mr. Chintan Dharod from the post of Company Secretary and Compliance Officer (Key Managerial Personnel) of the Company: 3. Appointed Ms. Ritu Shukla (Membership No. A63834 of ICSI) as Company Secretary and compliance officer of the company
Corporate Actions

No Upcoming Board Meetings

Raj Rayon Industries Ltd has declared 3% dividend, ex-date: 06 Sep 11

Raj Rayon Industries Ltd has announced 1:10 stock split, ex-date: 04 Mar 13

No Bonus history available

No Rights history available
Quality key factors
Valuation key factors
Technicals key factors
 Technical Indicator Scale: Bearish, Mildly Bearish, Sideways, Mildly Bullish, Bullish Turned
 Shareholding Snapshot : Mar 2026
Shareholding Compare (%holding)
Promoters
None
Held by 0 Schemes
Held by 0 FIIs
Svg Fashions Private Limited (84.88%)
Ankit Ganeriwal (1.23%)
5.63%
Quarterly Results Snapshot (Standalone) - Mar'26 - QoQ

QoQ Growth in quarter ended Mar 2026 is -3.46% vs -4.36% in Dec 2025
QoQ Growth in quarter ended Mar 2026 is 139.01% vs -26.81% in Dec 2025
Half Yearly Results Snapshot (Standalone) - Sep'25
Growth in half year ended Sep 2025 is 39.91% vs 24.49% in Sep 2024
Growth in half year ended Sep 2025 is 280.87% vs -288.62% in Sep 2024
Nine Monthly Results Snapshot (Standalone) - Dec'25
YoY Growth in nine months ended Dec 2025 is 37.51% vs 21.86% in Dec 2024
YoY Growth in nine months ended Dec 2025 is 5,444.44% vs -94.17% in Dec 2024
Annual Results Snapshot (Standalone) - Mar'26
YoY Growth in year ended Mar 2026 is 38.89% vs 13.98% in Mar 2025

YoY Growth in year ended Mar 2026 is 146.13% vs 241.83% in Mar 2025
About Raj Rayon Industries Ltd

Company Coordinates


