
Compare Rajas. Tube Mfg with Similar Stocks
Dashboard
With a Operating Losses, the company has a Weak Long Term Fundamental Strength
- Low ability to service debt as the company has a high Debt to EBITDA ratio of 0.55 times
Flat results in Mar 26
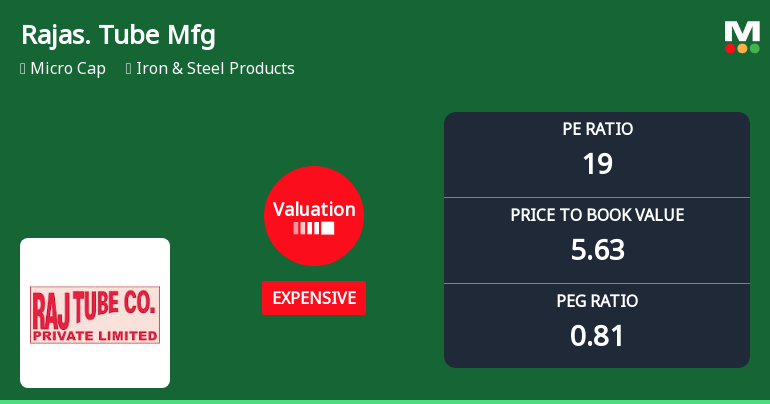
With ROE of 29, it has a Expensive valuation with a 6.6 Price to Book Value
Underperformed the market in the last 1 year
Stock DNA
Iron & Steel Products
INR 68 Cr (Micro Cap)
23.00
26
0.00%
-0.04
28.97%
7.16
Total Returns (Price + Dividend) 
Rajas. Tube Mfg for the last several years.
Risk Adjusted Returns v/s
Returns Beta

News

Rajasthan Tube Manufacturing Co Ltd Valuation Shifts to Very Expensive Amid Mixed Market Performance
Rajasthan Tube Manufacturing Co Ltd has seen a marked shift in its valuation parameters, moving from an expensive to a very expensive rating, despite a recent surge in its share price. The micro-cap player in the Iron & Steel Products sector now trades at a price-to-earnings (P/E) ratio of 23.78 and a price-to-book value (P/BV) of 6.89, signalling a significant premium relative to its historical averages and peer group. This article analyses the implications of these valuation changes in the context of the company’s financial performance and broader market trends.
Read full news article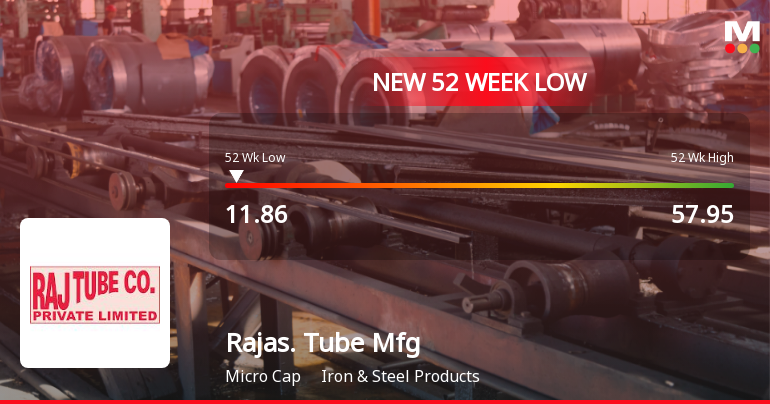
Rajasthan Tube Manufacturing Co Ltd Valuation Shifts to Expensive Amidst Market Challenges
Rajasthan Tube Manufacturing Co Ltd has seen a marked shift in its valuation parameters, moving from an attractive to an expensive rating, reflecting changing investor sentiment amid a challenging market environment. Despite a modest day gain of 0.24%, the stock’s price-to-earnings (P/E) and price-to-book value (P/BV) ratios now signal a premium valuation compared to its historical averages and peer group, raising questions about its price attractiveness for investors.
Read full news article Announcements
Announcement under Regulation 30 (LODR)-Newspaper Publication
08-Jun-2026 | Source : BSENewspaper publication for the result 31st March 2026
Integrated Filing (Financial) For The Quarter Ended 31St March 2026
01-Jun-2026 | Source : BSEIntegrated Filing (Financial) for the quarter ended 31st March2026
Revised Submission Of Audited Financial Results For The Quarter Ended 31St Marchr 2026
01-Jun-2026 | Source : BSERevised Financial Results for the quarter ended 31 st March 2026
Corporate Actions

No Upcoming Board Meetings

No Dividend history available

Rajasthan Tube Manufacturing Co Ltd has announced 1:10 stock split, ex-date: 08 May 25

No Bonus history available

No Rights history available
Quality key factors
Valuation key factors
Technicals key factors
 Technical Indicator Scale: Bearish, Mildly Bearish, Sideways, Mildly Bullish, Bullish Turned
 Shareholding Snapshot : Mar 2026
Shareholding Compare (%holding)
Non Institution
None
Held by 0 Schemes
Held by 0 FIIs
Rajshree Jain (5.4%)
Pushpa Bhaju (5.32%)
59.96%
Quarterly Results Snapshot (Standalone) - Mar'26 - YoY

YoY Growth in quarter ended Mar 2026 is -100.00% vs -58.26% in Mar 2025
YoY Growth in quarter ended Mar 2026 is -150.91% vs 1,933.33% in Mar 2025
Half Yearly Results Snapshot (Standalone) - Sep'25
Growth in half year ended Sep 2025 is -56.27% vs -37.79% in Sep 2024
Growth in half year ended Sep 2025 is -230.30% vs -162.26% in Sep 2024
Nine Monthly Results Snapshot (Standalone) - Dec'25
YoY Growth in nine months ended Dec 2025 is -64.92% vs -36.26% in Dec 2024

YoY Growth in nine months ended Dec 2025 is 395.08% vs -177.22% in Dec 2024
Annual Results Snapshot (Standalone) - Mar'26
YoY Growth in year ended Mar 2026 is -69.81% vs -40.64% in Mar 2025
YoY Growth in year ended Mar 2026 is 153.06% vs -31.94% in Mar 2025
About Rajasthan Tube Manufacturing Co Ltd

Company Coordinates


