Rajshree Sugars

INR
31.51
-1.41 (-4.28%)
BSENSE

Jul 21, 03:30 PM

BSE+NSE Vol: 1.01 lacs

  • Price Points
  • Score
  • Mojo Parameters
  • Total Return
  • News and Corporate Actions
  • Key factors
  • Shareholding
  • Financials
  • CompanyCV
stock-summaryPrice Point
High/Low

1Day

52 Week

Valuation
Technical
Day's Volume

CASH

1.01 lacs (118.24%) Volume

Shareholding (Jun 2026)

FII

0.00%

Held by 0 FIIs

DII

2.88%

Held by 0 DIIs

Promoter

40.72%

Are Rajshree Sugars & Chemicals Ltd latest results good or bad?

21-Jul-2026

Rajshree Sugars & Chemicals Ltd's latest Q1 FY27 results are concerning, showing a net loss of ₹23.33 crores and a significant decline in operating margins, indicating operational inefficiencies and high financial leverage. The company has faced losses in four of the last seven quarters, reflecting deeper structural issues.

Rajshree Sugars & Chemicals Ltd's latest results for Q1 FY27 indicate a challenging period for the company. The company reported a net loss of ₹23.33 crores, which is a significant decline of 64.98% compared to the previous quarter. This marks a troubling trend, as the company has now recorded operating losses in four of the past seven quarters.<BR><BR>While revenue showed some resilience, increasing by 8.73% year-on-year to ₹153.23 crores, it experienced a notable sequential decline of 18.90% from the previous quarter. The operating margin fell sharply to -9.13%, down from 27.45% in Q4 FY26, highlighting severe operational stress and inefficiencies.<BR><BR>The overall financial performance reflects not only seasonal challenges typical in the sugar industry but also deeper structural issues within the company's operations and cost management. The high leverage, with a debt to EBITDA ratio of 14.15 times, further complicates the situation, indicating significant difficulty in servicing its debt obligations.<BR><BR>In summary, the latest results for Rajshree Sugars are concerning, showcasing a combination of deepening losses, operational inefficiencies, and high financial leverage, which collectively paint a negative picture for the company's immediate outlook.

View full answer

Should I buy, sell or hold Rajshree Sugars & Chemicals Ltd?

21-Jul-2026

Why is Rajshree Sugars & Chemicals Ltd falling/rising?

20-Jul-2026

As of 20-Jul, Rajshree Sugars & Chemicals Ltd's stock price is rising to 32.78, reflecting a 2.34% increase due to strong investor interest and recent outperformance in its sector. The stock has shown a positive short-term trend, although it remains below some longer-term moving averages.

As of 20-Jul, Rajshree Sugars & Chemicals Ltd's stock price is rising, currently at 32.78, reflecting a change of 0.75 or 2.34% increase. This upward movement can be attributed to several factors. The stock has outperformed its sector by 2.43% today and has shown a consecutive gain over the last three days, accumulating a total return of 6.42% during this period. Additionally, there has been a notable increase in investor participation, with delivery volume on 17 July rising by 93.06% compared to the 5-day average, indicating heightened interest in the stock. <BR><BR>Moreover, the current price is higher than the 5-day, 20-day, and 100-day moving averages, suggesting a positive short-term trend, although it remains below the 50-day and 200-day moving averages. Overall, these factors contribute to the stock's rising price, despite its longer-term performance showing declines over 1 month, year-to-date, and year periods.

View full answer

When is the next results date for Rajshree Sugars & Chemicals Ltd?

14-Jul-2026

The next results date for Rajshree Sugars & Chemicals Ltd is July 20, 2026.

The next results date for Rajshree Sugars & Chemicals Ltd is scheduled for July 20, 2026.

View full answer

Who are in the management team of Rajshree Sugars?

11-Jun-2026

The management team of Rajshree Sugars includes Rajshree Pathy (Chairman), S Vasudevan, S Krishnaswami, Sheilendra Bhansali, and ILANGO K (all Independent Directors), along with R Varadarajan (Whole-time Director), who collectively guide the company's strategic direction and governance.

The management team of Rajshree Sugars includes the following individuals:<BR><BR>1. **Rajshree Pathy** - Chairman & Non-Executive Director<BR>2. **S Vasudevan** - Independent Director<BR>3. **S Krishnaswami** - Independent Director<BR>4. **Sheilendra Bhansali** - Independent Director<BR>5. **ILANGO K** - Independent Director<BR>6. **R Varadarajan** - Whole-time Director<BR><BR>Each member plays a crucial role in guiding the company's strategic direction and governance.

View full answer

Who are the peers of the Rajshree Sugars?

11-Jun-2026

Rajshree Sugars' peers include Sakthi Sugars, Rana Sugars, Indian Sucrose, and Dhampur.Spl.Sug., among others. Management risk varies from below average to average, with Dhampur.Spl.Sug. showing excellent growth and the highest 1-year return at 24.28%, while Rajshree Sugars has a 1-year return of -33.86%.

Peers: The peers of Rajshree Sugars are Sakthi Sugars, Rana Sugars, Indian Sucrose, Vishwaraj Sugar, Dhampur.Spl.Sug., Parvati Sweetner, Piccadily Sugar, Kesar Enterprise, Gayatri Sugars, and Kothari Sugars.<BR><BR>Quality Snapshot: Below Average management risk is observed at Sakthi Sugars, Rajshree Sugars, Dhampur.Spl.Sug., Parvati Sweetner, Piccadily Sugar, and Gayatri Sugars, while Average management risk is found at Rana Sugars, Indian Sucrose, Vishwaraj Sugar, Kesar Enterprise, and Kothari Sugars. Excellent growth is noted at Dhampur.Spl.Sug., while Average growth is seen at Rajshree Sugars and the rest. Below Average growth is observed at Sakthi Sugars, Rana Sugars, Indian Sucrose, Vishwaraj Sugar, Parvati Sweetner, Piccadily Sugar, Kesar Enterprise, and Gayatri Sugars. Good capital structure is present at Dhampur.Spl.Sug. and Kothari Sugars, while Below Average capital structure is found at Sakthi Sugars, Rajshree Sugars, Rana Sugars, Indian Sucrose, Vishwaraj Sugar, Parvati Sweetner, Piccadily Sugar, Kesar Enterprise, and Gayatri Sugars.<BR><BR>Return Snapshot: The peer with the highest 1-year return is Dhampur.Spl.Sug. at 24.28%, while the lowest is Vishwaraj Sugar at -48.11%. Rajshree Sugars has a 1-year return of -33.86%, which is higher than Vishwaraj Sugar's return but lower than Dhampur.Spl.Sug.'s. Additionally, the six-month return is negative for Sakthi Sugars, Rana Sugars, Indian Sucrose, Vishwaraj Sugar, Parvati Sweetner, Piccadily Sugar, and Gayatri Sugars.

View full answer

What does Rajshree Sugars do?

10-Jun-2026

Rajshree Sugars & Chemicals Ltd manufactures and markets white crystal sugar and industrial alcohol, with a market cap of INR 106 Cr. As of March 2026, it reported net sales of 189 Cr and a net profit of 32 Cr.

Overview: <BR>Rajshree Sugars & Chemicals Ltd is a company that manufactures and markets white crystal sugar and industrial alcohol, operating within the sugar industry and classified as a micro-cap.<BR><BR>History: <BR>Incorporated on 13 December 1985, Rajshree Sugars & Chemicals has maintained its operations in the sugar industry. The latest quarterly results reported net sales and net profit for the period ending March 2026.<BR><BR>Financial Snapshot: <BR>Net Sales: 189 Cr (Quarterly Results - Mar 2026) <BR>Net Profit: 32 Cr (Quarterly Results - Mar 2026) <BR>Market Cap: INR 106 Cr (Micro Cap)<BR><BR>Key Metrics: <BR>P/E: 36.00 <BR>Industry P/E: 19 <BR>Dividend Yield: 0.00% <BR>Debt-Equity: 1.35 <BR>Return on Equity: 1.25% <BR>Price to Book: 0.46 <BR><BR>Contact Details: <BR>Address: The Uffizi, 338/8 Avanashi Road Peelamedu Coimbatore Tamil Nadu : 641004 <BR>Tel: 91-422-4226222/2580981-82 <BR>Email: rscl@rajshreesugars.com <BR>Website: http://www.rajshreesugars.com

View full answer

How has been the historical performance of Rajshree Sugars?

03-Nov-2025

Rajshree Sugars' historical performance from March 2012 to March 2018 shows significant declines in net sales, operating income, and profits, with net sales dropping from INR 945.83 crore to INR 561.71 crore and a loss of INR 34.59 crore in profit after tax by March 2018. The company faced a challenging financial environment, reflected in decreased cash flow and negative profit before tax.

Answer:<BR>The historical performance of Rajshree Sugars shows significant fluctuations in its financial metrics over the years, particularly from March 2012 to March 2018.<BR><BR>Breakdown:<BR>Rajshree Sugars experienced a decline in net sales from INR 945.83 crore in March 2013 to INR 561.71 crore in March 2018, reflecting a downward trend in revenue. Total operating income followed a similar pattern, decreasing from INR 950.69 crore in March 2013 to INR 561.71 crore in March 2018. The company's raw material costs peaked at INR 766.14 crore in March 2013 but dropped to INR 237.40 crore by March 2018. Operating profit (PBDIT) saw a significant decline, falling from INR 126.46 crore in March 2013 to INR 36.32 crore in March 2018, while profit before tax turned negative in March 2018 at INR -49.08 crore, compared to a positive INR 45.87 crore in March 2017. Profit after tax also reflected this downturn, with a loss of INR 34.59 crore in March 2018, contrasting with a profit of INR 30.05 crore in March 2017. The earnings per share (EPS) decreased from INR 10.46 in March 2017 to INR 9.42 in March 2018. Cash flow from operating activities decreased from INR 204.42 crore in March 2017 to INR 129.37 crore in March 2018, while net cash outflow was recorded at INR -54.14 crore in March 2018, indicating a challenging financial environment for the company.

View full answer

Is Rajshree Sugars overvalued or undervalued?

19-Aug-2025

As of August 18, 2025, Rajshree Sugars is considered risky and overvalued with a negative PE ratio of -10.86 and a significant decline in stock returns, contrasting sharply with its peers EID Parry and Balrampur Chini.

As of 18 August 2025, the valuation grade for Rajshree Sugars has moved from very attractive to risky, indicating a significant shift in the company's perceived value. The company appears to be overvalued based on its current metrics, particularly with a price-to-earnings (PE) ratio of -10.86, an EV to EBITDA ratio of 24.94, and a return on equity (ROE) of -4.54%. <BR><BR>In comparison to its peers, EID Parry is categorized as very expensive with a PE ratio of 26.94, while Balrampur Chini is considered fair with a PE of 27.27. The stark contrast in valuation ratios suggests that Rajshree Sugars is not only underperforming relative to its peers but also facing significant challenges, as evidenced by its negative stock returns over the past year, which have declined by 44.65% compared to a modest 1.04% increase in the Sensex.

View full answer

How big is Rajshree Sugars?

24-Jul-2025

As of 24th July, Rajshree Sugars & Chemicals Ltd has a market capitalization of 155.00 Cr, classifying it as a Micro Cap company, with recent net sales of 641.82 Cr and a net profit of 8.09 Cr over the latest four quarters. Data for shareholder's funds and total assets is unavailable.

As of 24th July, <BR><BR>Market Cap: Rajshree Sugars & Chemicals Ltd has a market capitalization of 155.00 Cr, categorizing it as a Micro Cap company.<BR><BR>Recent Quarterly Performance: The sum of Net Sales for the latest 4 quarters is 641.82 Cr, while the sum of Net Profit for the same period is 8.09 Cr.<BR><BR>Balance Sheet Snapshot: The reporting period is the latest annual period. However, data for Shareholder's Funds and Total Assets is unavailable.

View full answer

Who are the top shareholders of the Rajshree Sugars?

06-Jun-2025

The top shareholder of Rajshree Sugars is Rajshree Pathy, owning 34.21%, while individual investors hold 39.41%. Promoter holdings are largely pledged, and institutional investors, including mutual funds and foreign investors, hold minimal stakes of 0.01%.

The top shareholders of Rajshree Sugars include a significant majority of non-institutional investors. The promoter with the highest holding is Rajshree Pathy, who owns 34.21% of the company. Additionally, individual investors collectively hold 39.41%. The company's promoter holdings are largely pledged, accounting for 99.8636%. Mutual funds and foreign institutional investors hold a minimal percentage, with mutual funds representing 0.01% through four schemes and one foreign institutional investor also holding 0.01%. The highest public shareholder is Pethinaidu Surulinarayanasami, who holds 0%.

View full answer

Has Rajshree Sugars declared dividend?

06-Jun-2025

Yes, Rajshree Sugars & Chemicals Ltd has declared a 30% dividend, but the dividend yield is 0%. Despite recent declines in shorter periods, total returns have significantly increased over the longer term, particularly in the last 4 and 5 years.

Rajshree Sugars & Chemicals Ltd has declared a 30% dividend.<BR><BR>Dividend Details:<BR>- Percentage announced: 30%<BR>- Ex-date: 15 Sep 10<BR><BR>Dividend Yield: 0%<BR><BR>Total Returns by Period:<BR>In the last 6 months, the price return was -23.93%, with no dividend return, resulting in a total return of -23.93%.<BR><BR>Over the past year, the price return was -16.89%, with no dividend return, leading to a total return of -16.89%.<BR><BR>In the 2-year period, the price return was 31.63%, with no dividend return, culminating in a total return of 31.63%.<BR><BR>For the 3-year period, the price return was 34.92%, with no dividend return, resulting in a total return of 34.92%.<BR><BR>In the last 4 years, the price return was 112.6%, with no dividend return, leading to a total return of 112.6%.<BR><BR>Over the past 5 years, the price return was 222.46%, with no dividend return, resulting in a total return of 222.46%.<BR><BR>Overall, while Rajshree Sugars declared a dividend, the dividend yield remains at 0%. The total returns indicate a significant increase over longer periods, particularly in the 4 and 5-year spans, despite recent declines in shorter periods.

View full answer
iScoreScore
Click here to find our call on this stock
Strong Sell
Sell
Hold
Buy
Strong Buy

Dashboard

1

With a Operating Losses, the company has a Weak Long Term Fundamental Strength

  • Poor long term growth as Net Sales has grown by an annual rate of 8.42% over the last 5 years
  • Low ability to service debt as the company has a high Debt to EBITDA ratio of 40.51 times
2

Flat results in Jun 26

3

100% of Promoter Shares are Pledged

4

Below par performance in long term as well as near term

stock-summaryMojo Parameters

Mojo Parameters

Loading Valuation Snapshot...

Stock DNA

stock-summary
Industry

Sugar

stock-summary
Market cap

INR 105 Cr (Micro Cap)

stock-summary
P/E

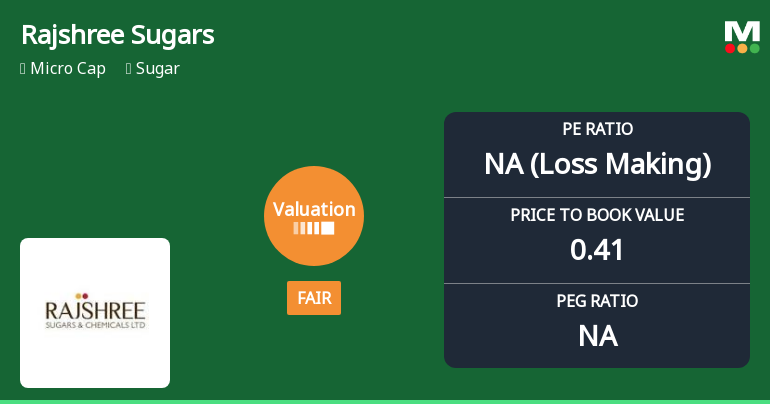
NA (Loss Making)

stock-summary
Industry P/E

21

stock-summary
Dividend Yield

0.00%

stock-summary
Debt Equity

1.23

stock-summary
Return on Equity

1.15%

stock-summary
Price to Book

0.41

Revenue and Profits:
Net Sales:
153 Cr
(Quarterly Results - Jun 2026)
Net Profit:
-23 Cr
stock-summaryTotal Returns
Total Returns (Price + Dividend) stock-summary
Dividend Yield (0%)
TimePeriod
Price Return
Dividend Return
Total Return
3 Months
-6.78%
0%
-6.78%
6 Months
4.37%
0%
4.37%
1 Year
-32.64%
0%
-32.64%
2 Years
-57.4%
0%
-57.4%
3 Years
-33.31%
0%
-33.31%
4 Years
-13.31%
0%
-13.31%
5 Years
0%
0%
0.0%

Latest dividend: 1.0000 per share ex-dividend date: Aug-16-2017

Risk Adjusted Returns v/s stock-summary
Returns Beta
Icon
Beta has not been calculated since enough price history is not available
stock-summaryNews & Corporate Actions

News

Announcements stock-summary

Rajshree Sugars & Chemicals Limited - Other General Purpose

09-Dec-2019 | Source : NSE

Rajshree Sugars & Chemicals Limited has informed the Exchange regarding Disclosure of Related Party Transaction under Regulation 23(9) of the SEBI (Listing Obligations and Disclosure Requirements) Regulations, 2015.

Rajshree Sugars & Chemicals Limited - Updates

18-Nov-2019 | Source : NSE

Rajshree Sugars & Chemicals Limited has informed the Exchange regarding 'Newspaper advertisement Extract of statement of Unaudited financial results for the quarter ended 30th September 2019 reg.

Rajshree Sugars & Chemicals Limited - Updates

08-Nov-2019 | Source : NSE

Rajshree Sugars & Chemicals Limited has informed the Exchange regarding 'Clause 51 of the Listing Regulations - Operational data for the month of October 2019.

Corporate Actions stock-summary

stock-summary
BOARD MEETING

No Upcoming Board Meetings

stock-summary
DIVIDEND

Rajshree Sugars & Chemicals Ltd has declared 30% dividend, ex-date: 15 Sep 10

stock-summary
SPLITS

No Splits history available

stock-summary
BONUS

No Bonus history available

stock-summary
RIGHTS

No Rights history available

stock-summaryKey Factors

Quality key factors stock-summary

Factor
Value
Sales Growth (5y)
8.42%
EBIT Growth (5y)
32.71%
EBIT to Interest (avg)
1.03
Debt to EBITDA (avg)
14.15
Net Debt to Equity (avg)
1.23
Sales to Capital Employed (avg)
1.10
Tax Ratio
10.73%
Dividend Payout Ratio
0
Pledged Shares
100.00%
Institutional Holding
2.88%
ROCE (avg)
1.47%
ROE (avg)
1.88%

Valuation key factors

Factor
Value
P/E Ratio
NA (Loss Making)
Industry P/E
21
Price to Book Value
0.40
EV to EBIT
78.25
EV to EBITDA
14.91
EV to Capital Employed
0.73
EV to Sales
0.77
PEG Ratio
NA
Dividend Yield
NA
ROCE (Latest)
-2.62%
ROE (Latest)
-2.34%

Technicals key factors

Indicator
Weekly
Monthly
MACD
Bearish
Bearish
RSI
No Signal
No Signal
Bollinger Bands
Bearish
Mildly Bearish
Moving Averages
Bearish (Daily)
KST
Mildly Bearish
Bearish
Dow Theory
Mildly Bullish
Mildly Bearish
OBV
Mildly Bullish
Mildly Bearish
stock-summary Technical Indicator Scale: Bearish, Mildly Bearish, Sideways, Mildly Bullish, Bullish  Turned 
stock-summaryShareholding
Shareholding Snapshot : Jun 2026stock-summary
Shareholding Compare (%holding) stock-summary
Majority shareholders

Non Institution

Pledged Promoter Holdings

100

Mutual Funds

Held by 4 Schemes (0.01%)

FIIs

Held by 0 FIIs

Promoter with highest holding

Rajshree Pathy (34.21%)

Highest Public shareholder

Icici Bank Ltd (2.54%)

Individual Investors Holdings

42.8%

stock-summaryFinancial
[
  {
    "link": "quarterly",
    "btn_text": "All Quarterly Results",
    "header": "Quarterly Results Snapshot (Standalone) - Jun'26 - QoQ",
    "rhs": [
      {
        "prefix": "Net Sales ",
        "suffix": "QoQ Growth in quarter ended Jun 2026 is -18.90% vs 92.81% in Mar 2026",
        "dir": -1
      },
      {
        "prefix": "Standalone Net Profit ",
        "suffix": "QoQ Growth in quarter ended Jun 2026 is -173.74% vs 444.29% in Mar 2026",
        "dir": -1
      }
    ],
    "table": {
      "header": [
        "Jun'26",
        "Mar'26",
        "Change(%)"
      ],
      "body": [
        {
          "field": "Net Sales",
          "val1": "153.23",
          "val2": "188.93",
          "chgp": "-18.90%",
          "chgp_class": "negative"
        },
        {
          "field": "Operating Profit (PBDIT) excl Other Income",
          "val1": "-13.99",
          "val2": "51.87",
          "chgp": "-126.97%",
          "chgp_class": "negative"
        },
        {
          "field": "Interest",
          "val1": "3.77",
          "val2": "4.32",
          "chgp": "-12.73%",
          "chgp_class": "positive"
        },
        {
          "field": "Exceptional Items",
          "val1": "0.00",
          "val2": "-0.42",
          "chgp": "100.00%",
          "chgp_class": "positive"
        },
        {
          "field": "Standalone Net Profit",
          "val1": "-23.33",
          "val2": "31.64",
          "chgp": "-173.74%",
          "chgp_class": "negative"
        },
        {
          "field": "Operating Profit Margin (Excl OI)",
          "val1": "-9.13%",
          "val2": "27.45%",
          "chgp": "-36.58%",
          "chgp_class": "negative"
        }
      ]
    }
  },
  {
    "link": "half-yearly",
    "btn_text": "All Half Yearly Results",
    "header": "Half Yearly Results Snapshot (Standalone) - Sep'25",
    "rhs": [
      {
        "prefix": "Net Sales ",
        "suffix": " Growth in half year ended Sep 2025 is -33.24% vs -12.43% in Sep 2024",
        "dir": -1
      },
      {
        "prefix": "Standalone Net Profit ",
        "suffix": " Growth in half year ended Sep 2025 is -227.89% vs -35.16% in Sep 2024",
        "dir": -1
      }
    ],
    "table": {
      "header": [
        "Sep'25",
        "Sep'24",
        "Change(%)"
      ],
      "body": [
        {
          "field": "Net Sales",
          "val1": "257.76",
          "val2": "386.09",
          "chgp": "-33.24%",
          "chgp_class": "negative"
        },
        {
          "field": "Operating Profit (PBDIT) excl Other Income",
          "val1": "-3.56",
          "val2": "26.93",
          "chgp": "-113.22%",
          "chgp_class": "negative"
        },
        {
          "field": "Interest",
          "val1": "6.58",
          "val2": "3.10",
          "chgp": "112.26%",
          "chgp_class": "negative"
        },
        {
          "field": "Exceptional Items",
          "val1": "0.00",
          "val2": "0.00",
          "chgp": "",
          "chgp_class": "neutral"
        },
        {
          "field": "Standalone Net Profit",
          "val1": "-21.32",
          "val2": "16.67",
          "chgp": "-227.89%",
          "chgp_class": "negative"
        },
        {
          "field": "Operating Profit Margin (Excl OI)",
          "val1": "-1.38%",
          "val2": "6.98%",
          "chgp": "-8.36%",
          "chgp_class": "negative"
        }
      ]
    }
  },
  {
    "link": "nine-monthly",
    "btn_text": "All Nine Monthly Results",
    "header": "Nine Monthly Results Snapshot (Standalone) - Dec'25",
    "rhs": [
      {
        "prefix": "Net Sales ",
        "suffix": "YoY Growth in nine months ended Dec 2025 is -23.87% vs -19.11% in Dec 2024",
        "dir": -1
      },
      {
        "prefix": "Standalone Net Profit ",
        "suffix": "YoY Growth in nine months ended Dec 2025 is -709.28% vs -84.80% in Dec 2024",
        "dir": -1
      }
    ],
    "table": {
      "header": [
        "Dec'25",
        "Dec'24",
        "Change(%)"
      ],
      "body": [
        {
          "field": "Net Sales",
          "val1": "355.75",
          "val2": "467.28",
          "chgp": "-23.87%",
          "chgp_class": "negative"
        },
        {
          "field": "Operating Profit (PBDIT) excl Other Income",
          "val1": "-14.38",
          "val2": "9.85",
          "chgp": "-245.99%",
          "chgp_class": "negative"
        },
        {
          "field": "Interest",
          "val1": "10.18",
          "val2": "6.90",
          "chgp": "47.54%",
          "chgp_class": "negative"
        },
        {
          "field": "Exceptional Items",
          "val1": "-1.59",
          "val2": "0.00",
          "chgp": "",
          "chgp_class": "neutral"
        },
        {
          "field": "Standalone Net Profit",
          "val1": "-30.51",
          "val2": "-3.77",
          "chgp": "-709.28%",
          "chgp_class": "negative"
        },
        {
          "field": "Operating Profit Margin (Excl OI)",
          "val1": "-4.04%",
          "val2": "2.11%",
          "chgp": "-6.15%",
          "chgp_class": "negative"
        }
      ]
    }
  },
  {
    "link": "annual",
    "btn_text": "All Annual Results",
    "header": "Annual Results Snapshot (Standalone) - Mar'26",
    "rhs": [
      {
        "prefix": "Net Sales ",
        "suffix": "YoY Growth in year ended Mar 2026 is -15.14% vs -15.95% in Mar 2025",
        "dir": 1
      },
      {
        "prefix": "Standalone Net Profit ",
        "suffix": "YoY Growth in year ended Mar 2026 is -85.91% vs -41.21% in Mar 2025",
        "dir": -1
      }
    ],
    "table": {
      "header": [
        "Mar'26",
        "Mar'25",
        "Change(%)"
      ],
      "body": [
        {
          "field": "Net Sales",
          "val1": "544.68",
          "val2": "641.82",
          "chgp": "-15.14%",
          "chgp_class": "negative"
        },
        {
          "field": "Operating Profit (PBDIT) excl Other Income",
          "val1": "37.50",
          "val2": "38.76",
          "chgp": "-3.25%",
          "chgp_class": "negative"
        },
        {
          "field": "Interest",
          "val1": "14.50",
          "val2": "15.97",
          "chgp": "-9.20%",
          "chgp_class": "positive"
        },
        {
          "field": "Exceptional Items",
          "val1": "-2.01",
          "val2": "0.00",
          "chgp": "",
          "chgp_class": "neutral"
        },
        {
          "field": "Standalone Net Profit",
          "val1": "1.14",
          "val2": "8.09",
          "chgp": "-85.91%",
          "chgp_class": "negative"
        },
        {
          "field": "Operating Profit Margin (Excl OI)",
          "val1": "6.88%",
          "val2": "6.04%",
          "chgp": "0.84%",
          "chgp_class": "positive"
        }
      ]
    }
  }
]

Quarterly Results Snapshot (Standalone) - Jun'26 - QoQstock-summary

Jun'26
Mar'26
Change(%)
Net Sales
153.23
188.93
-18.90%
Operating Profit (PBDIT) excl Other Income
-13.99
51.87
-126.97%
Interest
3.77
4.32
-12.73%
Exceptional Items
0.00
-0.42
100.00%
Standalone Net Profit
-23.33
31.64
-173.74%
Operating Profit Margin (Excl OI)
-9.13%
27.45%
-36.58%
Values in Rs Cr.
Direction Arrows
Net Sales

QoQ Growth in quarter ended Jun 2026 is -18.90% vs 92.81% in Mar 2026

Direction Arrows
Standalone Net Profit

QoQ Growth in quarter ended Jun 2026 is -173.74% vs 444.29% in Mar 2026

Half Yearly Results Snapshot (Standalone) - Sep'25stock-summary

Sep'25
Sep'24
Change(%)
Net Sales
257.76
386.09
-33.24%
Operating Profit (PBDIT) excl Other Income
-3.56
26.93
-113.22%
Interest
6.58
3.10
112.26%
Exceptional Items
0.00
0.00
Standalone Net Profit
-21.32
16.67
-227.89%
Operating Profit Margin (Excl OI)
-1.38%
6.98%
-8.36%
Values in Rs Cr.
Direction Arrows
Net Sales

Growth in half year ended Sep 2025 is -33.24% vs -12.43% in Sep 2024

Direction Arrows
Standalone Net Profit

Growth in half year ended Sep 2025 is -227.89% vs -35.16% in Sep 2024

Nine Monthly Results Snapshot (Standalone) - Dec'25stock-summary

Dec'25
Dec'24
Change(%)
Net Sales
355.75
467.28
-23.87%
Operating Profit (PBDIT) excl Other Income
-14.38
9.85
-245.99%
Interest
10.18
6.90
47.54%
Exceptional Items
-1.59
0.00
Standalone Net Profit
-30.51
-3.77
-709.28%
Operating Profit Margin (Excl OI)
-4.04%
2.11%
-6.15%
Values in Rs Cr.
Direction Arrows
Net Sales

YoY Growth in nine months ended Dec 2025 is -23.87% vs -19.11% in Dec 2024

Direction Arrows
Standalone Net Profit

YoY Growth in nine months ended Dec 2025 is -709.28% vs -84.80% in Dec 2024

Annual Results Snapshot (Standalone) - Mar'26stock-summary

Mar'26
Mar'25
Change(%)
Net Sales
544.68
641.82
-15.14%
Operating Profit (PBDIT) excl Other Income
37.50
38.76
-3.25%
Interest
14.50
15.97
-9.20%
Exceptional Items
-2.01
0.00
Standalone Net Profit
1.14
8.09
-85.91%
Operating Profit Margin (Excl OI)
6.88%
6.04%
0.84%
Values in Rs Cr.
Direction Arrows
Net Sales

YoY Growth in year ended Mar 2026 is -15.14% vs -15.95% in Mar 2025

Direction Arrows
Standalone Net Profit

YoY Growth in year ended Mar 2026 is -85.91% vs -41.21% in Mar 2025

stock-summaryCompany CV
About Rajshree Sugars & Chemicals Ltd stock-summary
stock-summary
Rajshree Sugars & Chemicals Ltd
Micro Cap
Sugar
Incorporated on 13 Dec.'85, Rajshree Sugars & Chemicals was promoted by the late G Varadraj of the Coimbatore-based P S G family. The company manufactures and markets white crystal sugar and industrial alcohol with installed capacities of 6000 tpd and 45 KL/day respectively. The Company is engaged in three segments, Sugar, Cogeneration and Distillery.
Company Coordinates stock-summary
Company Details
The Uffizi, 338/8 Avanashi Road Peelamedu Coimbatore Tamil Nadu : 641004
stock-summary
Tel: 91-422-4226222/2580981-82
stock-summary
rscl@rajshreesugars.com
Registrar Details
SKDC Consultants Ltd , Kanapathy Towers, 3rd Floor, Ganapathy, Coimbatore