
Compare Ratnabhumi Dev. with Similar Stocks
Dashboard
High Debt company with Weak Long Term Fundamental Strength
- High Debt Company with a Debt to Equity ratio (avg) of 3.02 times
- The company has been able to generate a Return on Equity (avg) of 4.61% signifying low profitability per unit of shareholders funds
With a fall in Operating Profit of -41.21%, the company declared Very Negative results in Mar 26
With ROCE of 10.8, it has a Very Expensive valuation with a 3 Enterprise value to Capital Employed
Total Returns (Price + Dividend) 
Ratnabhumi Dev. for the last several years.
Risk Adjusted Returns v/s
Returns Beta

News

Ratnabhumi Developers Ltd is Rated Sell
Ratnabhumi Developers Ltd is rated 'Sell' by MarketsMOJO, with this rating last updated on 26 May 2026. However, the analysis and financial metrics discussed here reflect the company’s current position as of 10 June 2026, providing investors with the latest insights into the stock’s fundamentals, valuation, financial trend, and technical outlook.
Read full news article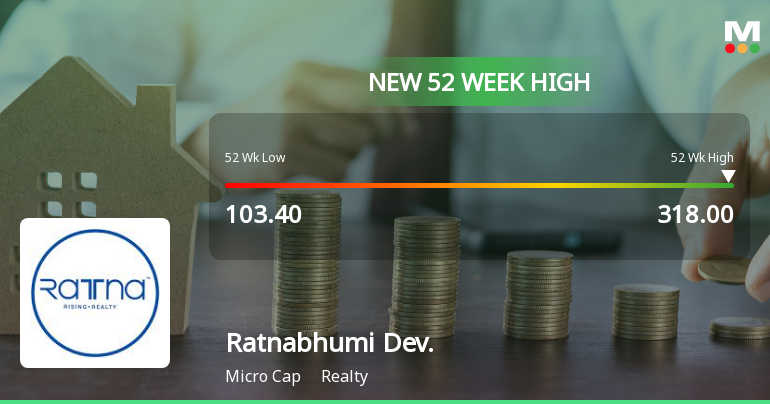
Broad-Based Technical Strength Lifts Ratnabhumi Developers Ltd to 52-Week High of Rs 318
Surging to an all-time high of Rs 318 on 2 Jun 2026, Ratnabhumi Developers Ltd has delivered a remarkable 204.55% return over the past year, vastly outperforming the Sensex’s decline of 8.83%. This milestone caps a sustained rally fuelled by a confluence of bullish technical indicators and robust price momentum, even as the broader market trades under pressure.
Read full news article
Ratnabhumi Developers Ltd Hits All-Time High of Rs 318 as Momentum Builds Across Timeframes
Surging past its previous peaks, Ratnabhumi Developers Ltd reached a fresh all-time high of Rs 318 on 2 Jun 2026, extending an impressive rally that has outpaced the broader market by a wide margin over multiple timeframes.
Read full news article Announcements
Announcement under Regulation 30 (LODR)-Newspaper Publication
22-May-2026 | Source : BSEExtract of Audited Consolidated Financial Results for the Quarter and Year ended 31st March 2026 in Financial Express in English and Gujarati.
Announcement under Regulation 30 (LODR)-Change in Management
21-May-2026 | Source : BSERe-appointment of Mrs. Avani Sanghavi (DIN 09156980) as the Non executive Independent Director for the second tenure of Five years.
Audited Financial Results For The Quarter And Year Ended 31St March 2026
21-May-2026 | Source : BSEAudited Financial Results for the Quarter and Year ended 31st March 2026
Corporate Actions

No Upcoming Board Meetings

No Dividend history available

No Splits history available

No Bonus history available

No Rights history available
Quality key factors
Valuation key factors
Technicals key factors
 Technical Indicator Scale: Bearish, Mildly Bearish, Sideways, Mildly Bullish, Bullish Turned
 Shareholding Snapshot : Mar 2026
Shareholding Compare (%holding)
Promoters
None
Held by 0 Schemes
Held by 0 FIIs
Kaivan Jitendrakumar Shah (73.56%)
Trine Projects India Private Limited (5.69%)
15.85%
Quarterly Results Snapshot (Consolidated) - Mar'26 - YoY

YoY Growth in quarter ended Mar 2026 is -56.88% vs 28,716.67% in Mar 2025
YoY Growth in quarter ended Mar 2026 is -89.35% vs 1,361.11% in Mar 2025
Half Yearly Results Snapshot (Consolidated) - Sep'25
Growth in half year ended Sep 2025 is -70.81% vs 40,015.15% in Sep 2024
Growth in half year ended Sep 2025 is -10.71% vs 4,100.00% in Sep 2024
Nine Monthly Results Snapshot (Consolidated) - Dec'25
YoY Growth in nine months ended Dec 2025 is -73.99% vs 31,285.96% in Dec 2024
YoY Growth in nine months ended Dec 2025 is -8.04% vs 3,787.50% in Dec 2024
Annual Results Snapshot (Consolidated) - Mar'26
YoY Growth in year ended Mar 2026 is -71.21% vs 76,139.29% in Mar 2025
YoY Growth in year ended Mar 2026 is -45.20% vs 2,103.85% in Mar 2025
About Ratnabhumi Developers Ltd

Company Coordinates


