
Compare Ratnaveer Precis with Similar Stocks
Dashboard
Healthy long term growth as Net Sales has grown by an annual rate of 30.60%
- INTEREST(9M) At Rs 17.08 cr has Grown at 136.89%
- OPERATING PROFIT TO INTEREST(Q) Lowest at 3.52 times
- ROCE(HY) Lowest at 9.61%
With ROE of 9.6, it has a Attractive valuation with a 1.7 Price to Book Value
Rising Promoter Confidence
Stock DNA
Iron & Steel Products
INR 1,105 Cr (Micro Cap)
17.00
26
0.00%
0.10
9.61%
1.64
Total Returns (Price + Dividend) 
Ratnaveer Precis for the last several years.
Risk Adjusted Returns v/s
Returns Beta

News

Ratnaveer Precision Engineering Ltd is Rated Hold
Ratnaveer Precision Engineering Ltd is rated 'Hold' by MarketsMOJO, with this rating last updated on 28 April 2026. However, the analysis and financial metrics discussed here reflect the company’s current position as of 12 June 2026, providing investors with the most up-to-date view of the stock’s fundamentals, returns, and technical outlook.
Read full news article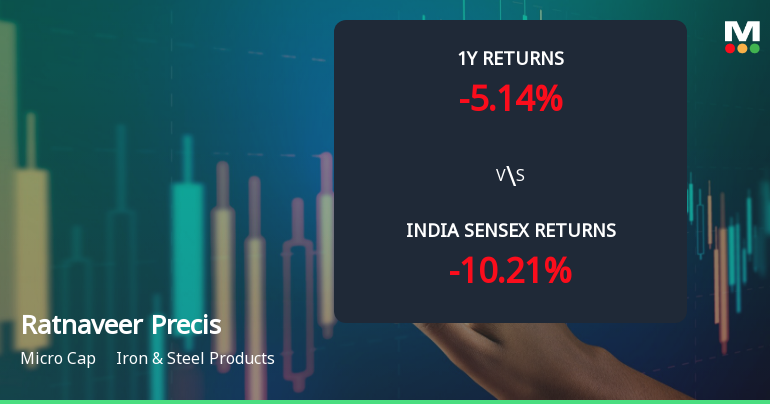
Ratnaveer Precision Engineering Ltd Sees Mixed Technical Signals Amid Mildly Bullish Momentum
Ratnaveer Precision Engineering Ltd, a micro-cap player in the Iron & Steel Products sector, has experienced a nuanced shift in its technical momentum, moving from a bullish to a mildly bullish stance. Despite a recent decline in price, the stock’s technical indicators present a complex picture, with some signals pointing to cautious optimism while others suggest underlying weakness. This article analyses the latest technical parameters, price action, and relative performance against the broader market to provide a comprehensive view for investors.
Read full news article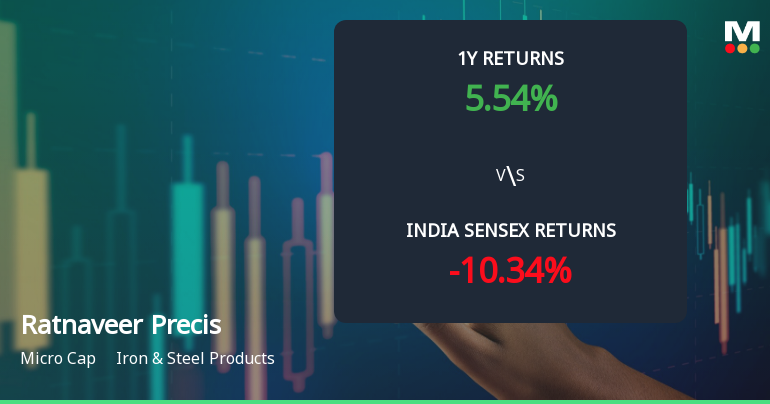
Ratnaveer Precision Engineering Ltd Technical Momentum Shifts Signal Bullish Outlook
Ratnaveer Precision Engineering Ltd, a micro-cap player in the Iron & Steel Products sector, has witnessed a notable shift in its technical momentum, moving from a mildly bullish stance to a more confident bullish trend. This upgrade is underpinned by a combination of positive signals from key technical indicators including MACD, Bollinger Bands, and moving averages, signalling renewed investor interest and potential upside in the near term.
Read full news article Announcements
Announcement under Regulation 30 (LODR)-Issue of Securities
11-Jun-2026 | Source : BSEFund Raising by way of issue of Equity Shares on a Right Issue basis.
Board Meeting Outcome for Fund Raising By Way Of Issue Of Equity Shares On A Right Issue
11-Jun-2026 | Source : BSEIssue of Fully paid Equity Shares having a face value of Rs. 10.00/- each for cash aggregating upto Rs. 330.00 Crores (Rupees Three Hundred Thirty Crores Only) to the eligible equity shareholders of the Company as on the Record date (to be determined by the Board in due course) on a rights basis (Rights Issue).
Board Meeting Intimation for Fund Raising
08-Jun-2026 | Source : BSERatnaveer Precision Engineering Ltdhas informed BSE that the meeting of the Board of Directors of the Company is scheduled on 11/06/2026 inter alia to consider and approve the proposal for raising of fund of the Company by way of issue of Equity Shares or any other securities through appropriate mode.
Corporate Actions

No Upcoming Board Meetings

No Dividend history available

No Splits history available

No Bonus history available

No Rights history available
Quality key factors
Valuation key factors
Technicals key factors
 Technical Indicator Scale: Bearish, Mildly Bearish, Sideways, Mildly Bullish, Bullish Turned
 Shareholding Snapshot : May 2026
Shareholding Compare (%holding)
Promoters
None
Held by 0 Schemes
Held by 6 FIIs (6.93%)
Vijay Ramanlal Sanghavi (42.89%)
Chungath Karunakaran Padma Kumar (3.77%)
35.87%
Quarterly Results Snapshot (Standalone) - Mar'26 - QoQ

QoQ Growth in quarter ended Mar 2026 is -7.55% vs -5.80% in Dec 2025
QoQ Growth in quarter ended Mar 2026 is 0.83% vs 9.46% in Dec 2025
Half Yearly Results Snapshot (Standalone) - Sep'25
Growth in half year ended Sep 2025 is 26.78% vs 66.91% in Sep 2024
Growth in half year ended Sep 2025 is 22.55% vs 53.12% in Sep 2024
Nine Monthly Results Snapshot (Standalone) - Dec'25
YoY Growth in nine months ended Dec 2025 is 19.02% vs 51.93% in Dec 2024
YoY Growth in nine months ended Dec 2025 is 30.94% vs 41.85% in Dec 2024
Annual Results Snapshot (Standalone) - Mar'26
YoY Growth in year ended Mar 2026 is 19.83% vs 49.80% in Mar 2025
YoY Growth in year ended Mar 2026 is 37.36% vs 50.79% in Mar 2025
About Ratnaveer Precision Engineering Ltd

Company Coordinates


