Ravi Leela Gran

  • Market Cap: Micro Cap
  • Industry: Miscellaneous
  • ISIN: INE427E01027
  • NSEID:
  • BSEID: 526095
INR
65.00
-2 (-2.99%)
BSENSE

Aug 11, 03:30 PM

BSE+NSE Vol: 546

  • Price Points
  • Score
  • Mojo Parameters
  • Total Return
  • News and Corporate Actions
  • Key factors
  • Shareholding
  • Financials
  • CompanyCV
stock-summaryPrice Point
High/Low

1Day

52 Week

Valuation
Technical
Day's Volume

CASH

546 (45.37%) Volume

Shareholding (Jun 2026)

FII

0.00%

Held by 0 FIIs

DII

0.00%

Held by 0 DIIs

Promoter

74.89%

Why is Ravi Leela Granites Ltd falling/rising?

10-Aug-2026

As of 10-Aug, Ravi Leela Granites Ltd's stock price has risen to Rs 67.00, reflecting a 1.52% increase, supported by strong performance indicators and a significant 93.19% rise over the past year. Despite a drop in investor participation, the stock remains liquid and continues to trade above its moving averages, indicating a bullish trend.

As of 10-Aug, Ravi Leela Granites Ltd is experiencing a rise in its stock price, currently at Rs 67.00, reflecting an increase of 1.0 (1.52%). This upward movement is supported by several positive indicators. Over the past week, the stock has gained 1.67%, while the benchmark Sensex has seen a slight decline of 0.12%. In the past month, the stock has performed exceptionally well, rising by 24.51% compared to a modest 1.25% increase in the Sensex.<BR><BR>The stock has also shown impressive performance over longer periods, with a remarkable 93.19% increase over the past year and a staggering 472.16% rise over the last five years. Today's trading activity indicates that the stock has outperformed its sector by 1.75% and has been on a consecutive gain streak for the last two days, accumulating a total return of 3.08% during this period. Additionally, the stock reached an intraday high of Rs 67.9, marking a 2.88% increase.<BR><BR>Ravi Leela Granites Ltd is trading above its moving averages across various time frames, including the 5-day, 20-day, 50-day, 100-day, and 200-day averages, which typically signals a strong bullish trend. However, it is worth noting that there has been a significant decline in investor participation, with delivery volume dropping by 93.61% compared to the 5-day average. Despite this decrease in participation, the stock remains liquid enough for trading.<BR><BR>Overall, the combination of strong recent performance, positive returns relative to the benchmark, and favorable moving averages contributes to the rising stock price of Ravi Leela Granites Ltd.

View full answer

Are Ravi Leela Granites Ltd latest results good or bad?

29-Jul-2026

Ravi Leela Granites Ltd's latest results show strong year-on-year revenue growth of 50.54% to ₹19.63 crores, but a 13.45% decline from the previous quarter, alongside a 27.58% increase in net profit to ₹2.39 crores, which is concerning due to a 38.56% drop from the prior quarter and reduced operating margins. Overall, while revenue growth is positive, the decline in profit and margins raises sustainability concerns.

Ravi Leela Granites Ltd's latest results present a mixed picture. On one hand, the company achieved a notable year-on-year revenue growth of 50.54%, reaching ₹19.63 crores in Q1 FY27, which is commendable and indicates strong demand recovery in the granite processing sector. However, this figure also reflects a 13.45% decline from the previous quarter, Q4 FY26, where revenues were significantly higher at ₹22.68 crores.<BR><BR>In terms of profitability, the net profit for Q1 FY27 was ₹2.39 crores, which is a 27.58% increase year-on-year. Nonetheless, it represents a concerning 38.56% drop from the previous quarter's profit of ₹3.89 crores. Additionally, the operating margin has significantly compressed to 22.87% from 36.66% in the same quarter last year, indicating operational challenges and rising costs.<BR><BR>Overall, while the revenue growth is a positive sign, the substantial decline in net profit and the erosion of margins raise questions about the sustainability of this growth. Investors may need to tread carefully, considering both the strong top-line performance and the underlying margin pressures.

View full answer

Should I buy, sell or hold Ravi Leela Granites Ltd?

29-Jul-2026

When is the next results date for Ravi Leela Granites Ltd?

24-Jul-2026

The next results date for Ravi Leela Granites Ltd is July 28, 2026.

The next results date for Ravi Leela Granites Ltd is scheduled for July 28, 2026.

View full answer

How big is Ravi Leela Gran?

11-Jun-2026

As of 10th June, Ravi Leela Granites Ltd has a market capitalization of 62.00 Cr, with recent net sales of 57.39 Cr and a net profit of 9.92 Cr. The company's shareholder's funds are 12.19 Cr, and total assets amount to 73.12 Cr.

As of 10th June, Ravi Leela Granites Ltd has a market capitalization of 62.00 Cr and is classified as a Micro Cap company.<BR><BR>In the latest four quarters, the company reported Net Sales of 57.39 Cr and a Net Profit of 9.92 Cr.<BR><BR>The latest annual period for the balance sheet is March 2025, showing Shareholder's Funds of 12.19 Cr and Total Assets of 73.12 Cr.

View full answer

Who are in the management team of Ravi Leela Gran?

11-Jun-2026

The management team of Ravi Leela Gran includes P Srinivas Reddy (Director), M Mohan Reddy (Independent Director), P Samantha Reddy (Whole Time Director & CFO), K Nandakumar (Independent Director), G Sreeramakrishna (Independent Director), and Kishwar Fatima (Company Secretary & Compliance Officer).

The management team of Ravi Leela Gran includes the following individuals:<BR><BR>1. **P Srinivas Reddy** - Director<BR>2. **M Mohan Reddy** - Independent Director<BR>3. **P Samantha Reddy** - Whole Time Director & CFO<BR>4. **K Nandakumar** - Independent Director<BR>5. **G Sreeramakrishna** - Independent Director<BR>6. **Kishwar Fatima** - Company Secretary & Compliance Officer<BR><BR>If you need more information about any specific member or their roles, feel free to ask!

View full answer

Who are the peers of the Ravi Leela Gran?

11-Jun-2026

Ravi Leela Gran's peers include Alkosign, Sundaram Multi., Anmol India, and others, with varying management and growth risks. Ravi Leela Gran leads with a 34.44% 1-year return, significantly outperforming its peers.

Peers: The peers of Ravi Leela Gran are Alkosign, Sundaram Multi., Anmol India, Mohini Health, ANI Integrated, Supreme Facility, AVSL Industries, Graphisads, Priti Internati., and Pulz Electronics.<BR><BR>Quality Snapshot: Below Average management risk is observed at Alkosign, Sundaram Multi., Mohini Health, ANI Integrated, and Graphisads, while Good management risk is found at Anmol India and AVSL Industries. Ravi Leela Gran has Below Average management risk. Growth is Good at Ravi Leela Gran, while Below Average growth is noted at Alkosign, Sundaram Multi., Mohini Health, ANI Integrated, Supreme Facility, Graphisads, and Priti Internati. Anmol India and AVSL Industries exhibit Below Average growth. Capital Structure ratings show Below Average at Alkosign, Sundaram Multi., Ravi Leela Gran, Mohini Health, Supreme Facility, and Graphisads, Average at Anmol India and ANI Integrated, and Good at Priti Internati.<BR><BR>Return Snapshot: The peer with the highest 1-year return is Ravi Leela Gran at 34.44%, while Sundaram Multi. has the lowest at -41.30%. Ravi Leela Gran's return is significantly higher than all its peers. Additionally, the six-month return is negative for Sundaram Multi. and Mohini Health.

View full answer

What does Ravi Leela Gran do?

10-Jun-2026

Ravi Leela Granites Ltd specializes in quarrying, cutting, and polishing granite, classified as a Micro Cap company with a market cap of INR 62 Cr. As of March 2026, it reported net sales of 23 Cr and a net profit of 4 Cr.

Overview: <BR>Ravi Leela Granites Ltd is engaged in the quarrying, cutting, and polishing of granite, operating within the Miscellaneous industry and classified as a Micro Cap company.<BR><BR>History: <BR>Incorporated in October 1990, Ravi Leela Granites Ltd became a public limited company in 1992. The latest quarterly results reported net sales and net profit for the period ending March 2026.<BR><BR>Financial Snapshot: <BR>Most recent Net Sales: 23 Cr (Quarterly Results - Mar 2026) <BR>Most recent Net Profit: 4 Cr (Quarterly Results - Mar 2026) <BR>Market-cap value: INR 62 Cr (Micro Cap)<BR><BR>Key Metrics: <BR>P/E: 6.00 <BR>Industry P/E: 11 <BR>Dividend Yield: 0.00% <BR>Debt-Equity: 2.56 <BR>Return on Equity: 45.40% <BR>Price to Book: 2.81 <BR><BR>Contact Details: <BR>Address: S No 203 Sampannabolu Village, Mandal Ranga Reddy Telangana : 500082 <BR>Tel: 91-1486-27408 <BR>Email: ravileel@yahoo.com <BR>Website: http://www.ravileelagranites.com

View full answer

Is Ravi Leela Gran overvalued or undervalued?

02-Dec-2025

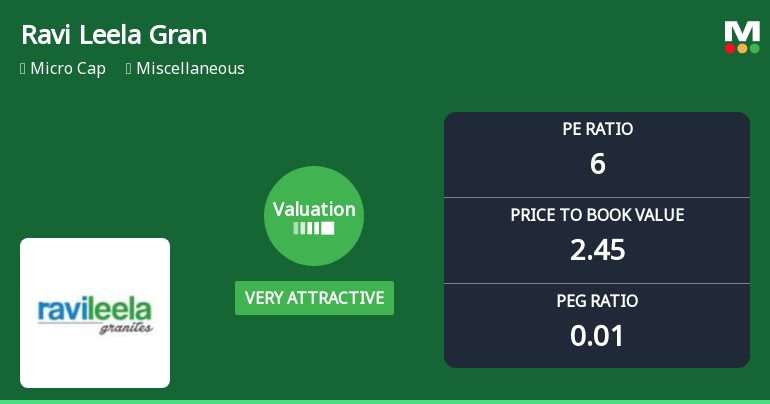
As of December 1, 2025, Ravi Leela Gran is rated very attractive due to its undervalued status with a PE ratio of 12.61, strong growth potential indicated by a PEG ratio of 0.05, and superior performance compared to peers and the Sensex.

As of 1 December 2025, the valuation grade for Ravi Leela Gran has moved from attractive to very attractive, indicating a significant improvement in its perceived value. The company is currently assessed as undervalued, supported by a PE ratio of 12.61, an EV to EBITDA of 11.20, and a PEG ratio of 0.05, which suggests strong growth potential relative to its price. <BR><BR>In comparison to its peers, Ravi Leela Gran's valuation metrics stand out, particularly against Coal India, which has a PE of 7.5, and NMDC with a PE of 9.43. This highlights Ravi Leela Gran's favorable positioning in the market. Additionally, the company has outperformed the Sensex over the year, with a stock return of 9.14% compared to the Sensex's 7.32%, reinforcing its attractiveness as an investment opportunity.

View full answer

How has been the historical performance of Ravi Leela Gran?

13-Nov-2025

Ravi Leela Gran has experienced fluctuating performance, with net sales increasing to 41.24 Cr in March 2025, but profitability declined significantly, resulting in a profit after tax of -3.21 Cr due to rising raw material costs and total expenditures exceeding income. Total liabilities and assets both rose to 73.12 Cr, while cash flow from operating activities turned negative at -2.00 Cr.

Answer:<BR>The historical performance of Ravi Leela Gran shows a fluctuating trend in net sales and profitability over the years. <BR><BR>Breakdown:<BR>In terms of net sales, the company reported an increase to 41.24 Cr in March 2025 from 31.47 Cr in March 2024, following a pattern of growth from 29.61 Cr in March 2023. However, the total operating income also reflects this increase, reaching 41.24 Cr in March 2025. The raw material costs surged to 23.23 Cr in March 2025, up from 15.22 Cr in the previous year, contributing to a total expenditure of 41.27 Cr, which exceeded the operating income, resulting in an operating profit (PBDIT) of -0.03 Cr. This marks a significant decline from the previous year's profit of 5.63 Cr. The profit before tax also turned negative at -3.75 Cr in March 2025, compared to a slight profit of 0.13 Cr in March 2024. Consequently, the profit after tax fell to -3.21 Cr from -0.60 Cr, indicating a downward trend in profitability. The company's total liabilities increased to 73.12 Cr in March 2025 from 67.77 Cr in March 2024, while total assets also rose to 73.12 Cr, reflecting a balance in the financial position. Cash flow from operating activities showed a negative trend, with -2.00 Cr in March 2025, down from 3.00 Cr in March 2024. Overall, Ravi Leela Gran has faced challenges in maintaining profitability despite an increase in sales and total income.

View full answer

What is the technical trend for Ravi Leela Gran?

09-Jun-2025

As of June 6, 2025, Ravi Leela Gran's technical trend has shifted to a moderately strong bearish stance, indicated by bearish MACD and moving averages, along with a lack of momentum in the RSI and mildly bearish Bollinger Bands.

As of 6 June 2025, the technical trend for Ravi Leela Gran has changed from mildly bearish to bearish. The current stance is bearish with a moderate strength. Key indicators driving this conclusion include a bearish MACD on the weekly chart, bearish moving averages on the daily timeframe, and a mildly bearish KST on the weekly. The RSI shows no signals, indicating a lack of momentum in either direction. The Bollinger Bands are also indicating a mildly bearish trend on the weekly. Overall, the technicals suggest a downward pressure on the stock.

View full answer

Who are the top shareholders of the Ravi Leela Gran?

06-Jun-2025

The top shareholders of Ravi Leela Gran include Srinivas Reddy Parvat with 71.61%, the Ravileela Granites Limited Unclaimed Suspense Account at 8.8%, and individual investors holding 13.53%. There are no holdings by mutual funds or foreign institutional investors.

The top shareholders of Ravi Leela Gran are primarily the promoters, with Srinivas Reddy Parvat holding the largest share at 71.61%. The highest public shareholder is the Ravileela Granites Limited Unclaimed Suspense Account, which holds 8.8%. Additionally, individual investors collectively own 13.53% of the company's shares. There are currently no holdings by mutual funds or foreign institutional investors.

View full answer

Has Ravi Leela Gran declared dividend?

06-Jun-2025

No Dividend History Available

iScoreScore
Click here to find our call on this stock
Strong Sell
Sell
Hold
Buy
Strong Buy

Dashboard

1

High Debt company with Weak Long Term Fundamental Strength

  • Poor long term growth as Net Sales has grown by an annual rate of 12.54% over the last 5 years
  • High Debt Company with a Debt to Equity ratio (avg) of 2.76 times
  • The company has been able to generate a Return on Capital Employed (avg) of 4.27% signifying low profitability per unit of total capital (equity and debt)
2

The company has declared Positive results for the last 6 consecutive quarters

3

With ROCE of 14.4, it has a Attractive valuation with a 1.6 Enterprise value to Capital Employed

4

Majority shareholders : Promoters

 
5

Market Beating Performance

stock-summaryMojo Parameters

Mojo Parameters

Loading Valuation Snapshot...

Stock DNA

stock-summary
Industry

Miscellaneous

stock-summary
Market cap

INR 69 Cr (Micro Cap)

stock-summary
P/E

8.00

stock-summary
Industry P/E

10

stock-summary
Dividend Yield

0.00%

stock-summary
Debt Equity

2.56

stock-summary
Return on Equity

41.24%

stock-summary
Price to Book

3.25

Revenue and Profits:
Net Sales:
20 Cr
(Quarterly Results - Jun 2026)
Net Profit:
2 Cr
stock-summaryTotal Returns
Total Returns (Price + Dividend) stock-summary
Dividend Yield (0%)
TimePeriod
Price Return
Dividend Return
Total Return
3 Months
0%
0%
0.0%
6 Months
30.0%
0%
30.0%
1 Year
80.81%
0%
80.81%
2 Years
73.56%
0%
73.56%
3 Years
109.68%
0%
109.68%
4 Years
74.97%
0%
74.97%
5 Years
428.89%
0%
428.89%

Ravi Leela Gran for the last several years.

Risk Adjusted Returns v/s stock-summary
Returns Beta
Icon
Beta has not been calculated since enough price history is not available
stock-summaryNews & Corporate Actions

News

Ravi Leela Granites Gains 10.66%: 2 Key Factors Driving the Surge

Announcements stock-summary

Announcement under Regulation 30 (LODR)-Newspaper Publication

30-Jul-2026 | Source : BSE

We wish to inform your esteemed organization that the Company has published Un-audited Financial Results for the quarter ended 30th June 2026 on 30th July 2026 in the following newspapers: 1. Financial Express (English Language) 2. Nava Telangana (Regional Language)

Announcement under Regulation 30 (LODR)-Change in Management

28-Jul-2026 | Source : BSE

We wish to inform your esteemed organization that based on the recommendation of the Nomination and Remuneration Committee the Board of Directors of the Company at its meeting held on Tuesday 28th July 2026 approved the appointment of Ms. Parvatha Harshini Reddy as an Additional Director (Non-Executive and Non-Independent).

Results - Financial Results For The Quarter Ended 30Th June 2026

28-Jul-2026 | Source : BSE

The Board of Directors in their meeting held on Tuesday 28th July 2026 have considered and approved the Un-audited financial results for the quarter ended 30th June 2026 and took note of the Limited Review Report for the quarter ended 30th June 2026.

Corporate Actions stock-summary

stock-summary
BOARD MEETING

No Upcoming Board Meetings

stock-summary
DIVIDEND

No Dividend history available

stock-summary
SPLITS

No Splits history available

stock-summary
BONUS

No Bonus history available

stock-summary
RIGHTS

No Rights history available

stock-summaryKey Factors

Quality key factors stock-summary

Factor
Value
Sales Growth (5y)
12.54%
EBIT Growth (5y)
37.87%
EBIT to Interest (avg)
1.12
Debt to EBITDA (avg)
18.70
Net Debt to Equity (avg)
2.56
Sales to Capital Employed (avg)
0.56
Tax Ratio
22.93%
Dividend Payout Ratio
0
Pledged Shares
0
Institutional Holding
0
ROCE (avg)
1.80%
ROE (avg)
10.08%

Valuation key factors

Factor
Value
P/E Ratio
8
Industry P/E
10
Price to Book Value
3.15
EV to EBIT
11.43
EV to EBITDA
9.70
EV to Capital Employed
1.60
EV to Sales
1.95
PEG Ratio
0.01
Dividend Yield
NA
ROCE (Latest)
14.38%
ROE (Latest)
41.24%

Technicals key factors

Indicator
Weekly
Monthly
MACD
Bullish
Bullish
RSI
No Signal
No Signal
Bollinger Bands
Mildly Bullish
Bullish
Moving Averages
Bullish (Daily)
KST
Bullish
Bullish
Dow Theory
No Trend
Mildly Bearish
stock-summary Technical Indicator Scale: Bearish, Mildly Bearish, Sideways, Mildly Bullish, Bullish  Turned 
stock-summaryShareholding
Shareholding Snapshot : Jun 2026stock-summary
Shareholding Compare (%holding) stock-summary
Majority shareholders

Promoters

Pledged Promoter Holdings

None

Mutual Funds

Held by 0 Schemes

FIIs

Held by 0 FIIs

Promoter with highest holding

Parvat Srinivas Reddy (71.61%)

Highest Public shareholder

Vasantha Reddy Janna (1.33%)

Individual Investors Holdings

13.64%

stock-summaryFinancial
[
  {
    "link": "quarterly",
    "btn_text": "All Quarterly Results",
    "header": "Quarterly Results Snapshot (Standalone) - Jun'26 - QoQ",
    "rhs": [
      {
        "prefix": "Net Sales ",
        "suffix": "QoQ Growth in quarter ended Jun 2026 is -13.45% vs 149.23% in Mar 2026",
        "dir": -1
      },
      {
        "prefix": "Standalone Net Profit ",
        "suffix": "QoQ Growth in quarter ended Jun 2026 is -38.56% vs 1,396.15% in Mar 2026",
        "dir": -1
      }
    ],
    "table": {
      "header": [
        "Jun'26",
        "Mar'26",
        "Change(%)"
      ],
      "body": [
        {
          "field": "Net Sales",
          "val1": "19.63",
          "val2": "22.68",
          "chgp": "-13.45%",
          "chgp_class": "negative"
        },
        {
          "field": "Operating Profit (PBDIT) excl Other Income",
          "val1": "4.49",
          "val2": "3.61",
          "chgp": "24.38%",
          "chgp_class": "positive"
        },
        {
          "field": "Interest",
          "val1": "0.60",
          "val2": "0.64",
          "chgp": "-6.25%",
          "chgp_class": "positive"
        },
        {
          "field": "Exceptional Items",
          "val1": "0.00",
          "val2": "0.00",
          "chgp": "",
          "chgp_class": "neutral"
        },
        {
          "field": "Standalone Net Profit",
          "val1": "2.39",
          "val2": "3.89",
          "chgp": "-38.56%",
          "chgp_class": "negative"
        },
        {
          "field": "Operating Profit Margin (Excl OI)",
          "val1": "22.87%",
          "val2": "15.92%",
          "chgp": "6.95%",
          "chgp_class": "positive"
        }
      ]
    }
  },
  {
    "link": "half-yearly",
    "btn_text": "All Half Yearly Results",
    "header": "Half Yearly Results Snapshot (Standalone) - Sep'25",
    "rhs": [
      {
        "prefix": "Net Sales ",
        "suffix": " Growth in half year ended Sep 2025 is 53.17% vs -13.64% in Sep 2024",
        "dir": 1
      },
      {
        "prefix": "Standalone Net Profit ",
        "suffix": " Growth in half year ended Sep 2025 is 521.90% vs -434.15% in Sep 2024",
        "dir": 1
      }
    ],
    "table": {
      "header": [
        "Sep'25",
        "Sep'24",
        "Change(%)"
      ],
      "body": [
        {
          "field": "Net Sales",
          "val1": "25.61",
          "val2": "16.72",
          "chgp": "53.17%",
          "chgp_class": "positive"
        },
        {
          "field": "Operating Profit (PBDIT) excl Other Income",
          "val1": "8.22",
          "val2": "0.09",
          "chgp": "9,033.33%",
          "chgp_class": "positive"
        },
        {
          "field": "Interest",
          "val1": "1.51",
          "val2": "1.50",
          "chgp": "0.67%",
          "chgp_class": "negative"
        },
        {
          "field": "Exceptional Items",
          "val1": "0.00",
          "val2": "0.00",
          "chgp": "",
          "chgp_class": "neutral"
        },
        {
          "field": "Standalone Net Profit",
          "val1": "5.78",
          "val2": "-1.37",
          "chgp": "521.90%",
          "chgp_class": "positive"
        },
        {
          "field": "Operating Profit Margin (Excl OI)",
          "val1": "32.10%",
          "val2": "0.54%",
          "chgp": "31.56%",
          "chgp_class": "positive"
        }
      ]
    }
  },
  {
    "link": "nine-monthly",
    "btn_text": "All Nine Monthly Results",
    "header": "Nine Monthly Results Snapshot (Standalone) - Dec'25",
    "rhs": [
      {
        "prefix": "Net Sales ",
        "suffix": "YoY Growth in nine months ended Dec 2025 is 38.51% vs 5.83% in Dec 2024",
        "dir": 1
      },
      {
        "prefix": "Standalone Net Profit ",
        "suffix": "YoY Growth in nine months ended Dec 2025 is 302.68% vs -309.86% in Dec 2024",
        "dir": 1
      }
    ],
    "table": {
      "header": [
        "Dec'25",
        "Dec'24",
        "Change(%)"
      ],
      "body": [
        {
          "field": "Net Sales",
          "val1": "34.71",
          "val2": "25.06",
          "chgp": "38.51%",
          "chgp_class": "positive"
        },
        {
          "field": "Operating Profit (PBDIT) excl Other Income",
          "val1": "9.54",
          "val2": "0.25",
          "chgp": "3,716.00%",
          "chgp_class": "positive"
        },
        {
          "field": "Interest",
          "val1": "2.27",
          "val2": "2.21",
          "chgp": "2.71%",
          "chgp_class": "negative"
        },
        {
          "field": "Exceptional Items",
          "val1": "0.00",
          "val2": "0.00",
          "chgp": "",
          "chgp_class": "neutral"
        },
        {
          "field": "Standalone Net Profit",
          "val1": "6.04",
          "val2": "-2.98",
          "chgp": "302.68%",
          "chgp_class": "positive"
        },
        {
          "field": "Operating Profit Margin (Excl OI)",
          "val1": "27.48%",
          "val2": "1.00%",
          "chgp": "26.48%",
          "chgp_class": "positive"
        }
      ]
    }
  },
  {
    "link": "annual",
    "btn_text": "All Annual Results",
    "header": "Annual Results Snapshot (Standalone) - Mar'26",
    "rhs": [
      {
        "prefix": "Net Sales ",
        "suffix": "YoY Growth in year ended Mar 2026 is 39.19% vs 31.05% in Mar 2025",
        "dir": 1
      },
      {
        "prefix": "Standalone Net Profit ",
        "suffix": "YoY Growth in year ended Mar 2026 is 409.35% vs -435.00% in Mar 2025",
        "dir": 1
      }
    ],
    "table": {
      "header": [
        "Mar'26",
        "Mar'25",
        "Change(%)"
      ],
      "body": [
        {
          "field": "Net Sales",
          "val1": "57.40",
          "val2": "41.24",
          "chgp": "39.19%",
          "chgp_class": "positive"
        },
        {
          "field": "Operating Profit (PBDIT) excl Other Income",
          "val1": "13.15",
          "val2": "-0.03",
          "chgp": "43,933.33%",
          "chgp_class": "positive"
        },
        {
          "field": "Interest",
          "val1": "2.91",
          "val2": "3.01",
          "chgp": "-3.32%",
          "chgp_class": "positive"
        },
        {
          "field": "Exceptional Items",
          "val1": "0.00",
          "val2": "0.00",
          "chgp": "",
          "chgp_class": "neutral"
        },
        {
          "field": "Standalone Net Profit",
          "val1": "9.93",
          "val2": "-3.21",
          "chgp": "409.35%",
          "chgp_class": "positive"
        },
        {
          "field": "Operating Profit Margin (Excl OI)",
          "val1": "22.91%",
          "val2": "-0.07%",
          "chgp": "22.98%",
          "chgp_class": "positive"
        }
      ]
    }
  }
]

Quarterly Results Snapshot (Standalone) - Jun'26 - QoQstock-summary

Jun'26
Mar'26
Change(%)
Net Sales
19.63
22.68
-13.45%
Operating Profit (PBDIT) excl Other Income
4.49
3.61
24.38%
Interest
0.60
0.64
-6.25%
Exceptional Items
0.00
0.00
Standalone Net Profit
2.39
3.89
-38.56%
Operating Profit Margin (Excl OI)
22.87%
15.92%
6.95%
Values in Rs Cr.
Direction Arrows
Net Sales

QoQ Growth in quarter ended Jun 2026 is -13.45% vs 149.23% in Mar 2026

Direction Arrows
Standalone Net Profit

QoQ Growth in quarter ended Jun 2026 is -38.56% vs 1,396.15% in Mar 2026

Half Yearly Results Snapshot (Standalone) - Sep'25stock-summary

Sep'25
Sep'24
Change(%)
Net Sales
25.61
16.72
53.17%
Operating Profit (PBDIT) excl Other Income
8.22
0.09
9,033.33%
Interest
1.51
1.50
0.67%
Exceptional Items
0.00
0.00
Standalone Net Profit
5.78
-1.37
521.90%
Operating Profit Margin (Excl OI)
32.10%
0.54%
31.56%
Values in Rs Cr.
Direction Arrows
Net Sales

Growth in half year ended Sep 2025 is 53.17% vs -13.64% in Sep 2024

Direction Arrows
Standalone Net Profit

Growth in half year ended Sep 2025 is 521.90% vs -434.15% in Sep 2024

Nine Monthly Results Snapshot (Standalone) - Dec'25stock-summary

Dec'25
Dec'24
Change(%)
Net Sales
34.71
25.06
38.51%
Operating Profit (PBDIT) excl Other Income
9.54
0.25
3,716.00%
Interest
2.27
2.21
2.71%
Exceptional Items
0.00
0.00
Standalone Net Profit
6.04
-2.98
302.68%
Operating Profit Margin (Excl OI)
27.48%
1.00%
26.48%
Values in Rs Cr.
Direction Arrows
Net Sales

YoY Growth in nine months ended Dec 2025 is 38.51% vs 5.83% in Dec 2024

Direction Arrows
Standalone Net Profit

YoY Growth in nine months ended Dec 2025 is 302.68% vs -309.86% in Dec 2024

Annual Results Snapshot (Standalone) - Mar'26stock-summary

Mar'26
Mar'25
Change(%)
Net Sales
57.40
41.24
39.19%
Operating Profit (PBDIT) excl Other Income
13.15
-0.03
43,933.33%
Interest
2.91
3.01
-3.32%
Exceptional Items
0.00
0.00
Standalone Net Profit
9.93
-3.21
409.35%
Operating Profit Margin (Excl OI)
22.91%
-0.07%
22.98%
Values in Rs Cr.
Direction Arrows
Net Sales

YoY Growth in year ended Mar 2026 is 39.19% vs 31.05% in Mar 2025

Direction Arrows
Standalone Net Profit

YoY Growth in year ended Mar 2026 is 409.35% vs -435.00% in Mar 2025

stock-summaryCompany CV
About Ravi Leela Granites Ltd stock-summary

stock-summary
Ravi Leela Granites Ltd
Micro Cap
Miscellaneous
Incorporated in October, 1990, Ravi Leela Granites Limited became a public limited company in 1992. The Company was promoted by P Srinivas Reddy and Lok Manohar Reddy. Initially, Company engaged in the business of quarrying, cutting and polishing of granite for exports. It manufactures granite tiles with an installed capacity of 43,158 sq. mtr.
Company Coordinates stock-summary
Company Details
S No 203 Sampannabolu Village, Mandal Ranga Reddy Telangana : 500082
stock-summary
Tel: 91-1486-27408
stock-summary
ravileel@yahoo.com
Registrar Details
Aarthi Consultants Pvt Ltd, 1-2-285 , Domalaguda, Hyderabad