
Compare Raymond Lifestyl with Similar Stocks
Dashboard
Weak Long Term Fundamental Strength with a -35.45% CAGR growth in Operating Profits over the last 5 years
- Company's ability to service its debt is weak with a poor EBIT to Interest (avg) ratio of 0.97
- The company has been able to generate a Return on Equity (avg) of 1.27% signifying low profitability per unit of shareholders funds
Flat results in Mar 26
Below par performance in long term as well as near term
Stock DNA
Garments & Apparels
INR 4,825 Cr (Small Cap)
31.00
25
0.00%
0.13
1.62%
0.50
Total Returns (Price + Dividend) 
Raymond Lifestyl for the last several years.
Risk Adjusted Returns v/s
Returns Beta

News

Raymond Lifestyle Ltd Faces Mildly Bearish Momentum Amid Technical Shifts
Raymond Lifestyle Ltd has experienced a notable shift in its technical momentum, with key indicators signalling a transition from sideways movement to a mildly bearish trend. Despite some mildly bullish cues on weekly MACD and Dow Theory, the overall technical landscape suggests caution for investors amid recent price declines and deteriorating momentum.
Read full news article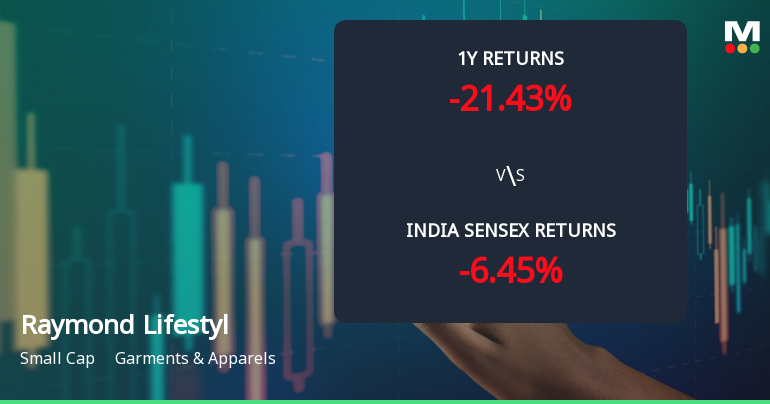
Raymond Lifestyle Ltd Technical Momentum Shifts Amid Mixed Market Signals
Raymond Lifestyle Ltd has exhibited a notable shift in its technical momentum, moving from a mildly bearish stance to a sideways trend, reflecting a complex interplay of bullish and neutral signals across key indicators. Despite a modest day gain of 1.45%, the stock’s broader performance remains challenged, with a Mojo Grade downgrade to Strong Sell signalling caution for investors.
Read full news article
Raymond Lifestyle Ltd is Rated Strong Sell
Raymond Lifestyle Ltd is rated Strong Sell by MarketsMOJO, with this rating last updated on 02 March 2026. However, the analysis and financial metrics discussed here reflect the company’s current position as of 21 June 2026, providing investors with an up-to-date view of the stock’s fundamentals, returns, and technical outlook.
Read full news article Announcements
Notice Of The Annual General Meeting For FY 2025-26
23-Jun-2026 | Source : BSENotice of Annual General Meeting for FY 2025-26
Announcement under Regulation 30 (LODR)-Newspaper Publication
23-Jun-2026 | Source : BSEPlease find advertisement regarding 8th AGM of the Company Published in todays Newspaper
Business Responsibility and Sustainability Reporting (BRSR)
23-Jun-2026 | Source : BSEPlease find attached intimation regarding Business Responsibility and Sustainability Reporting.
Corporate Actions

No Upcoming Board Meetings

Raymond Lifestyle Ltd has declared 50% dividend, ex-date: 29 Jun 26

No Splits history available

No Bonus history available

No Rights history available
Quality key factors
Valuation key factors
Technicals key factors
 Technical Indicator Scale: Bearish, Mildly Bearish, Sideways, Mildly Bullish, Bullish Turned
 Shareholding Snapshot : Mar 2026
Shareholding Compare (%holding)
Promoters
20.8426
Held by 10 Schemes (2.95%)
Held by 105 FIIs (8.7%)
J K Investors (bombay) Limited (38.02%)
Uti Value Fund (1.92%)
19.99%
Quarterly Results Snapshot (Consolidated) - Mar'26 - QoQ

QoQ Growth in quarter ended Mar 2026 is -3.91% vs 0.89% in Dec 2025
QoQ Growth in quarter ended Mar 2026 is -221.47% vs -43.00% in Dec 2025
Half Yearly Results Snapshot (Consolidated) - Sep'25

Growth in half year ended Sep 2025 is 11.42% vs -6.28% in Sep 2024
Growth in half year ended Sep 2025 is 191.88% vs -99.16% in Sep 2024
Nine Monthly Results Snapshot (Consolidated) - Dec'25
YoY Growth in nine months ended Dec 2025 is 9.16% vs -3.47% in Dec 2024
YoY Growth in nine months ended Dec 2025 is 18.15% vs -96.55% in Dec 2024
Annual Results Snapshot (Consolidated) - Mar'26
YoY Growth in year ended Mar 2026 is 11.52% vs -5.49% in Mar 2025
YoY Growth in year ended Mar 2026 is 20.90% vs -98.56% in Mar 2025
About Raymond Lifestyle Ltd

Company Coordinates


