
Compare RBL Bank with Similar Stocks
Dashboard
With a growth in Operating Profit of 10.94%, the company declared Very Positive results in Mar 26
- The company has declared positive results for the last 2 consecutive quarters
- GROSS NPA(Q) Lowest at 1.45%
- NII(Q) Highest at Rs 1,670.96 cr
- INTEREST EARNED(Q) Highest at Rs 3,720.25 cr
High Institutional Holdings at 63.57%
Market Beating performance in long term as well as near term
Total Returns (Price + Dividend) 
Latest dividend: 1 per share ex-dividend date: Sep-08-2025
Risk Adjusted Returns v/s
Returns Beta

News
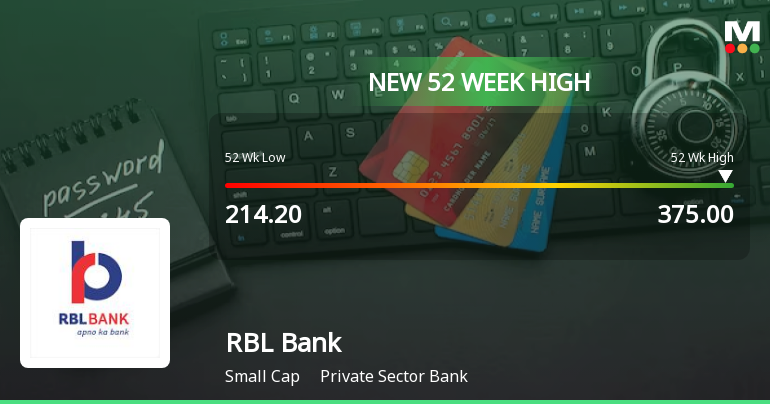
Broad-Based Technical Strength Lifts RBL Bank Ltd to 52-Week High of Rs 375
Surging to a fresh 52-week high of Rs 375 on 15 Jun 2026, RBL Bank Ltd has demonstrated remarkable price momentum, outpacing the broader market with a 67.74% gain over the past year compared to the Sensex’s decline of 5.52%. This rally is underpinned by a confluence of bullish technical indicators and sustained upward price action across multiple timeframes.
Read full news article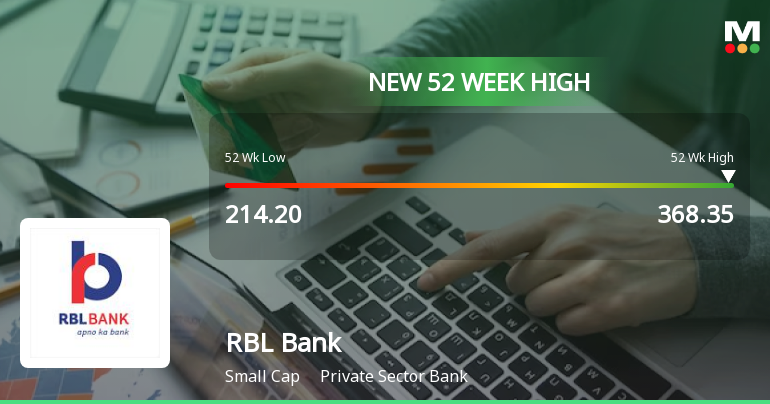
Broad-Based Technical Strength Lifts RBL Bank Ltd to 52-Week High of Rs 368.35
With a surge to Rs 368.35 on 12 Jun 2026, RBL Bank Ltd has reached a fresh 52-week high, extending its impressive 64.15% gain over the past year. This milestone comes amid a backdrop of strong technical momentum and a market environment where the broader Sensex has also rallied sharply, albeit from a lower base.
Read full news article
Broad-Based Technical Strength Lifts RBL Bank Ltd to 52-Week High of Rs 366.3
Surging past its previous peaks, RBL Bank Ltd touched a fresh 52-week high of Rs 366.3 on 11 Jun 2026, marking a remarkable 65% rally from its low of Rs 214.2 over the past year. This milestone comes amid a backdrop of strong technical momentum that sets the stock apart from the broader market’s subdued performance.
Read full news article Announcements
Updates on Open Offer
13-Jun-2026 | Source : BSEJ.P. Morgan India Pvt Ltd (Manager to the Open Offer) has infomed BSE regarding the updates on Open offer for acquisition of up to 415586443 equity shares of Rs. 10 each (Equity Shares) of RBL Bank Ltd (Target Company) representing 26.00% (twenty-six per cent) of the Expanded Voting Share Capital from the Public Shareholders by Emirates NBD Bank (P.J.S.C.) (Acquirer) pursuant to and in compliance with the requirements of the Securities and Exchange Board of India (Substantial Acquisition of Shares and Takeovers) Regulations 2011 as amended (the SEBI (SAST) Regulations) (the Open Offer/Offer).
Board Meeting Outcome for RBL Bank Limited Informs The Exchange About Outcome Of Board Meeting
12-Jun-2026 | Source : BSERBL Bank Limited informs the exchange about Outcome of Board Meeting.
Announcement under Regulation 30 (LODR)-Change in Management
12-Jun-2026 | Source : BSERBL Bank Limited informs the exchange about change in management.
Corporate Actions

No Upcoming Board Meetings

RBL Bank Ltd has declared 10% dividend, ex-date: 08 Sep 25

No Splits history available

No Bonus history available

No Rights history available
Quality key factors
Valuation key factors
Technicals key factors
 Technical Indicator Scale: Bearish, Mildly Bearish, Sideways, Mildly Bullish, Bullish Turned
 Shareholding Snapshot : Mar 2026
Shareholding Compare (%holding)
Mutual Funds
None
Held by 39 Schemes (36.76%)
Held by 191 FIIs (20.23%)
None
Quant Mutual Fund - Quant Small Cap Fund (6.13%)
23.89%
Quarterly Results Snapshot (Standalone) - Mar'26 - YoY

YoY Growth in quarter ended Mar 2026 is 7.04% vs 4.09% in Mar 2025
YoY Growth in quarter ended Mar 2026 is 234.37% vs -80.52% in Mar 2025
Half Yearly Results Snapshot (Standalone) - Sep'25

Growth in half year ended Sep 2025 is -1.12% vs 19.84% in Sep 2024
Growth in half year ended Sep 2025 is -36.22% vs 2.04% in Sep 2024
Nine Monthly Results Snapshot (Standalone) - Dec'25
YoY Growth in nine months ended Dec 2025 is 0.49% vs 16.66% in Dec 2024
YoY Growth in nine months ended Dec 2025 is -5.42% vs -23.13% in Dec 2024
Annual Results Snapshot (Standalone) - Mar'26
YoY Growth in year ended Mar 2026 is 2.11% vs 13.27% in Mar 2025
YoY Growth in year ended Mar 2026 is 18.27% vs -40.46% in Mar 2025
About RBL Bank Ltd

Company Coordinates


