Bandhan Bank

  • Market Cap: Small Cap
  • Industry: Private Sector Bank
  • ISIN: INE545U01014
  • NSEID: BANDHANBNK
  • BSEID: 541153
INR
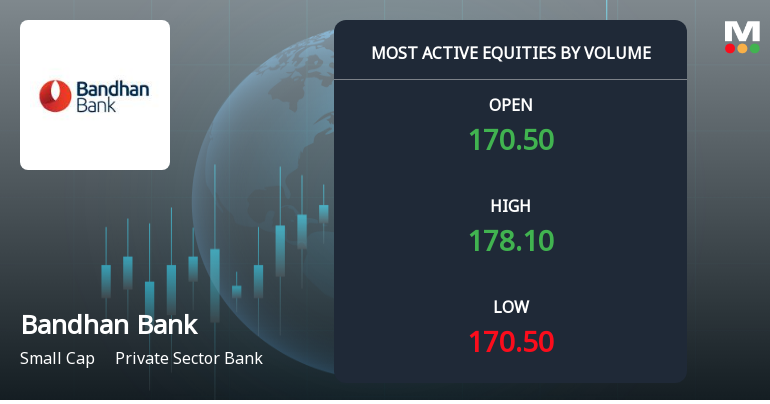
184.70
6.05 (3.39%)
BSENSE

Sep 22, 03:30 PM

BSE+NSE Vol: 2.36 cr

  • Price Points
  • Score
  • Mojo Parameters
  • Total Return
  • News and Corporate Actions
  • Key factors
  • Shareholding
  • Financials
  • CompanyCV
stock-summaryPrice Point
High/Low

1Day

52 Week

Valuation
Technical
Day's Volume

CASH

2.36 cr (59.65%) Volume

Shareholding (Jun 2026)

FII

18.65%

Held by 262 FIIs

DII

27.55%

Held by 111 DIIs

Promoter

37.54%

Why is Bandhan Bank Ltd. falling/rising?

06-Sep-2026

As of 05-Sep, Bandhan Bank Ltd. is seeing a slight rise in stock price to 165.00, but has shown declines over the past week and month. Despite positive management efficiency and recent growth in profits, the stock's performance relative to moving averages and decreased investor participation indicates caution for investors.

As of 05-Sep, Bandhan Bank Ltd. is experiencing a slight rise in its stock price, currently at 165.00, with a change of 0.8 (0.49%) upward. This increase follows a trend where the stock has gained for the last two days, resulting in a total return of 2.04% during this period. Despite this recent uptick, the stock has shown a decline over the past week and month, with returns of -1.87% and -4.90%, respectively. <BR><BR>The stock's performance today is described as inline with the sector, but it is important to note that Bandhan Bank is trading below its moving averages across various time frames, indicating a potential weakness in its price momentum. Additionally, there has been a significant drop in investor participation, with delivery volume decreasing by 44.17% compared to the five-day average, which may suggest a lack of confidence among investors.<BR><BR>On a positive note, the bank has demonstrated high management efficiency with a return on assets (ROA) of 1.80% and a strong capital adequacy ratio of 17.40%, indicating a solid buffer against risks. Furthermore, recent financial results have shown impressive growth in profit before tax and a decrease in gross non-performing assets, which could contribute to a more favorable outlook for the stock in the long term. However, despite these positive indicators, the stock's overall performance has been lackluster over longer periods, with a year-to-date return of +13.21% compared to a -10.21% decline in the benchmark Sensex, and a significant drop of -30.14% over the past three years. <BR><BR>In summary, while Bandhan Bank Ltd. is currently experiencing a rise in its stock price, the broader context of declining investor participation and its performance relative to moving averages suggests caution for investors.

View full answer

Who are in the management team of Bandhan Bank?

01-Sep-2026

The management team of Bandhan Bank includes Chandra Shekhar Ghosh (Managing Director & CEO), Anup Kumar Sinha (Chairman), and several non-executive and independent directors, bringing diverse expertise to the bank's governance.

The management team of Bandhan Bank includes the following key members:<BR><BR>1. **Chandra Shekhar Ghosh** - Managing Director & CEO<BR>2. **Holger Dirk Michaelis** - Nominee<BR>3. **Indranil Banerjee** - Company Secretary & Compliance Officer<BR>4. **Anup Kumar Sinha** - Chairman & Independent Director<BR>5. **Ratan Kumar Kesh** - Executive Director<BR><BR>Additionally, there are several non-executive and independent directors on the board:<BR><BR>- **ALLAMRAJU SUBRAMANYA RAMASASTRI** - Non-Executive & Independent Director<BR>- **Santanu Mukherjee** - Non-Executive & Independent Director<BR>- **NVP Tendulkar** - Non-Executive & Independent Director<BR>- **Vijay N Bhatt** - Non-Executive & Independent Director<BR>- **Suhail Chander** - Non-Executive & Independent Director<BR>- **Subrata Dutta Gupta** - Independent Director<BR>- **Ms Divya Krishnan** - Non-Executive & Non-Independent Director<BR>- **Aparajita Mitra** - Non-Executive & Independent Director<BR>- **Philip Mathew** - Non-Executive & Independent Director<BR><BR>This diverse team brings a wealth of experience and expertise to the bank's operations and governance.

View full answer

What does Bandhan Bank do?

01-Sep-2026

Bandhan Bank Limited is a commercial bank in India focused on serving underbanked markets, having transitioned from a microfinance entity. As of June 2026, it reported net sales of ₹5,630.55 crore and a net profit of ₹502 crore, with a market cap of ₹26,744 crore.

Overview: <BR>Bandhan Bank Limited is a commercial bank focused on serving underbanked and underpenetrated markets in India, categorized as a small-cap entity in the private sector banking industry.<BR><BR>History: <BR>Bandhan Bank was incorporated as a commercial bank after transforming from a microfinance entity. The latest quarterly results reported are for June 2026, showing sales and profit figures.<BR><BR>Financial Snapshot: <BR>Most recent Net Sales: 5,630.55 Cr (Quarterly Results - Jun 2026) <BR>Most recent Net Profit: 502 Cr (Quarterly Results - Jun 2026) <BR>Market-cap value: INR 26,744 Cr (Small Cap)<BR><BR>Key Metrics: <BR>P/E: N/A <BR>Industry P/E: N/A <BR>Dividend Yield: 0.89% <BR>Debt-Equity: N/A <BR>ROE: N/A <BR>Price-to-Book: N/A <BR><BR>Contact Details: <BR>Address: DN 32 Sector V, Salt Lake Kolkata West Bengal : 700091 <BR>Phone: 91-33-66090909 <BR>Email: investors@bandhanbank.com <BR>Website: http://www.bandhanbank.com

View full answer

Who are the peers of the Bandhan Bank?

01-Sep-2026

Bandhan Bank's peers include IndusInd Bank, IDFC First Bank, Yes Bank, RBL Bank, Karur Vysya Bank, City Union Bank, J&K Bank, T N Merc. Bank, and Karnataka Bank. Bandhan Bank shows below-average growth and the lowest 1-year return among its peers, while T N Merc. Bank has the highest return at 120.17%.

Peers: The peers of Bandhan Bank are IndusInd Bank, IDFC First Bank, Yes Bank, RBL Bank, Karur Vysya Bank, City Union Bank, J&K Bank, T N Merc. Bank, and Karnataka Bank.<BR><BR>Quality Snapshot: Excellent management risk is observed at Karur Vysya Bank, while Good management risk is found at IndusInd Bank, City Union Bank, J&K Bank, Bandhan Bank, and Karnataka Bank. Average management risk is present at IDFC First Bank, Yes Bank, RBL Bank, and T N Merc. Bank. Below Average growth is noted at Bandhan Bank, while Excellent growth is seen at IDFC First Bank and Karur Vysya Bank, and Good growth is found at Yes Bank, RBL Bank, City Union Bank, J&K Bank, and Karnataka Bank. Excellent capital structure is noted at IndusInd Bank, Karur Vysya Bank, RBL Bank, City Union Bank, T N Merc. Bank, and Karnataka Bank, while Good capital structure is observed at IDFC First Bank, Yes Bank, and J&K Bank.<BR><BR>Return Snapshot: The peer with the highest 1-year return is T N Merc. Bank at 120.17%, while Bandhan Bank has the lowest at 1.27%. Bandhan Bank's 1-year return is significantly lower than the average of its peers. Additionally, Bandhan Bank, Yes Bank, and RBL Bank have negative six-month returns.

View full answer

How big is Bandhan Bank?

01-Sep-2026

As of 31st August, Bandhan Bank Ltd. has a market capitalization of 26,744.00 Cr and a Net Profit of 1,353.27 Cr for the latest four quarters, with Shareholder's Funds at 25,574.89 Cr and Total Assets of 2,11,453.58 Cr. There is no valid Net Sales data available.

As of 31st August, Bandhan Bank Ltd. has a market capitalization of 26,744.00 Cr, categorizing it as a Small Cap company.<BR><BR>In terms of recent quarterly performance, there is no valid Net Sales data found for summing, resulting in a value of 0.00 Cr. However, the Net Profit for the latest four quarters is reported at 1,353.27 Cr.<BR><BR>The latest annual period for the balance sheet is March 2026. Shareholder's Funds are recorded at 25,574.89 Cr, while Total Assets amount to 2,11,453.58 Cr.

View full answer

Should I buy, sell or hold Bandhan Bank Ltd.?

30-Jul-2026

Are Bandhan Bank Ltd. latest results good or bad?

22-Jul-2026

Bandhan Bank Ltd.'s latest results show a mixed performance: while net interest income reached a record high and asset quality improved, net profit declined sequentially and total income growth was modest, indicating caution for investors regarding profitability and growth.

Bandhan Bank Ltd.'s latest results present a mixed picture. On one hand, the bank achieved a net interest income (NII) of ₹2,920.58 crores, which is a 5.92% increase year-on-year and the highest quarterly NII in its history. Additionally, the gross non-performing assets (GNPA) ratio improved significantly, declining to 3.15% from 4.96% a year ago, marking the lowest level in recent quarters. This indicates a positive trend in asset quality management.<BR><BR>However, the net profit for the quarter was ₹501.67 crores, reflecting a 34.87% increase year-on-year but a sequential decline of 6.08% from the previous quarter. This drop in profit suggests some normalization after an exceptionally strong prior quarter. Furthermore, the total income growth was modest, with only a 0.57% increase quarter-on-quarter and 0.53% year-on-year, indicating challenges in revenue momentum.<BR><BR>Overall, while there are strong indicators of improving asset quality and record NII, the decline in net profit and tepid revenue growth suggest that the results are not entirely favorable. Investors may view the bank's performance as a step in the right direction, but with caution regarding its profitability and growth trajectory.

View full answer

When is the next results date for Bandhan Bank Ltd.?

16-Jul-2026

The next results date for Bandhan Bank Ltd. is July 21, 2026.

The next results date for Bandhan Bank Ltd. is scheduled for July 21, 2026.

View full answer

Is Bandhan Bank technically bullish or bearish?

04-Dec-2025

As of December 3, 2025, Bandhan Bank's technical outlook is bearish, supported by indicators like the weekly MACD, Bollinger Bands, and moving averages, along with significant underperformance against the Sensex.

As of 3 December 2025, the technical trend has changed from mildly bearish to bearish. The current technical stance for Bandhan Bank is bearish, with a moderate strength. Key indicators driving this stance include the weekly MACD and Bollinger Bands both indicating bearish conditions, along with daily moving averages also showing bearish signals. The weekly KST and Dow Theory are mildly bearish, reinforcing the overall bearish outlook. The stock has underperformed significantly against the Sensex over various time frames, further supporting the bearish sentiment.

View full answer

Is Bandhan Bank overvalued or undervalued?

04-Dec-2025

As of December 3, 2025, Bandhan Bank is considered an attractive investment due to its undervalued status, with a PE ratio of 19.25 and a price-to-book value of 0.96, despite a year-to-date return of -7.67%, compared to its peers like HDFC Bank and ICICI Bank, which are deemed expensive.

As of 3 December 2025, the valuation grade for Bandhan Bank has moved from fair to attractive, indicating a more favorable assessment of its market position. The company is currently deemed undervalued, supported by a PE ratio of 19.25, a price-to-book value of 0.96, and a PEG ratio of 0.00, which suggests that the stock is trading below its intrinsic value relative to earnings growth expectations.<BR><BR>In comparison to its peers, Bandhan Bank's valuation stands out; for instance, HDFC Bank has a PE ratio of 21.63, and ICICI Bank has a PE ratio of 20.07, both categorized as expensive. Despite recent stock performance lagging behind the Sensex, with a year-to-date return of -7.67% compared to the Sensex's 8.92%, the underlying financial metrics and improved valuation grade suggest that Bandhan Bank presents a compelling investment opportunity at its current price of 146.80.

View full answer

How has been the historical performance of Bandhan Bank?

31-Oct-2025

Bandhan Bank has shown consistent growth from March 2020 to March 2025, with significant increases in interest earned, net interest income, and total income, while facing rising expenditures and fluctuating cash reserves. Total assets grew substantially, reflecting the bank's robust financial performance despite challenges.

Answer:<BR>The historical performance of Bandhan Bank shows a consistent growth trajectory in various financial metrics over the years.<BR><BR>Breakdown:<BR>Bandhan Bank's interest earned has increased significantly from INR 10,885.49 crore in March 2020 to INR 21,948.23 crore in March 2025, reflecting a strong upward trend. The net interest income also rose from INR 6,323.91 crore in March 2020 to INR 11,490.58 crore in March 2025. Total income followed suit, climbing from INR 12,434.69 crore in March 2020 to INR 24,914.83 crore in March 2025. However, interest expended also increased, from INR 4,561.58 crore in March 2020 to INR 10,457.65 crore in March 2025, indicating rising costs. The profit before tax saw a notable increase from INR 4,053.42 crore in March 2020 to INR 3,623.28 crore in March 2025, while profit after tax improved from INR 3,023.74 crore in March 2020 to INR 2,745.30 crore in March 2025. The bank's total assets grew from INR 91,905.37 crore in March 2020 to INR 1,91,835.64 crore in March 2025, and total liabilities increased from INR 91,905.37 crore to INR 1,91,835.64 crore in the same period. Cash and cash equivalents fluctuated, ending at INR 9,567 crore in March 2025, down from INR 16,168 crore in March 2024. Overall, Bandhan Bank has demonstrated robust growth in income and assets, although it has faced challenges with rising expenditures and fluctuating cash reserves.

View full answer

Who are the top shareholders of the Bandhan Bank?

06-Jun-2025

The top shareholders of Bandhan Bank include Bandhan Financial Holdings Limited (39.98%), Foreign Institutional Investors (22.73%), mutual funds (8.96%), Caladium Investment Pte. Ltd. (4.04%), and individual investors (17.46%). The majority of shares are held by promoters, with no pledged promoter holdings reported.

The top shareholders of Bandhan Bank include:<BR><BR>1. **Bandhan Financial Holdings Limited** - This entity is the largest shareholder, holding 39.98% of the bank's shares.<BR>2. **Foreign Institutional Investors (FIIs)** - They collectively hold 22.73% of the shares, with 262 different FIIs involved.<BR>3. **Mutual Funds** - A total of 30 mutual fund schemes hold 8.96% of the shares.<BR>4. **Caladium Investment Pte. Ltd.** - This is the highest public shareholder, owning 4.04%.<BR>5. **Individual Investors** - They account for 17.46% of the total shareholding.<BR><BR>Overall, the majority of the shares are held by promoters, and there are no pledged promoter holdings reported.

View full answer

Has Bandhan Bank declared dividend?

06-Jun-2025

Yes, Bandhan Bank has declared a 15% dividend, amounting to ₹1.5 per share, with an ex-date of August 11, 2023. However, total returns over various periods have shown a consistent decline in price, indicating minimal benefits for investors.

Bandhan Bank Ltd. has declared a 15% dividend.<BR><BR>Dividend Details:<BR>- Percentage announced: 15%<BR>- Amount per share: 1.5<BR>- Ex-date: 11 Aug 23<BR><BR>Dividend Yield: 0%<BR><BR>Total Returns by Period:<BR>In the 6-month period, the price return was -2.01%, the dividend return was 0%, resulting in a total return of -2.01%.<BR><BR>For the 1-year period, the price return was -9.84%, the dividend return was 0%, leading to a total return of -9.84%.<BR><BR>Over the 2-year period, the price return was -34.5%, the dividend return was 0.60%, culminating in a total return of -33.9%.<BR><BR>In the 3-year period, the price return was -47.0%, the dividend return was 0.53%, resulting in a total return of -46.47%.<BR><BR>For the 4-year period, the price return was -45.13%, the dividend return was 0.72%, leading to a total return of -44.41%.<BR><BR>In the 5-year period, the price return was -30.21%, the dividend return was 0.72%, culminating in a total return of -29.49%.<BR><BR>Overall, while Bandhan Bank has declared a dividend, the total returns over various periods indicate a consistent decline in price, with minimal contributions from dividends. This suggests that investors may not have seen significant benefits from their investments in the bank during these timeframes.

View full answer
iScoreScore
Click here to find our call on this stock
Strong Sell
Sell
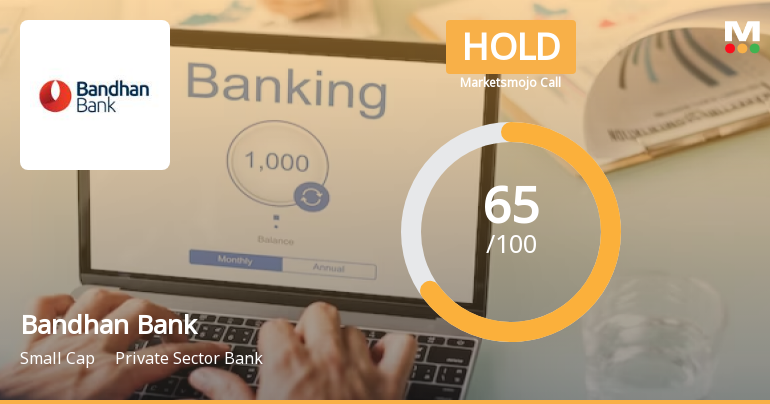
Hold
Buy
Strong Buy

Dashboard

1

High Management Efficiency with a high ROA of 1.80%

 
2

The Bank has a high Capital Adequacy Ratio of 17.40% signifying high buffers against its risk based assets

 
3

Poor long term growth as Net profit has grown by an annual rate of -7.78%

 
4

Positive results in Jun 26

5

With ROA of 0.6, it has a Expensive valuation with a 1.2 Price to Book Value

6

Reducing Promoter Confidence

7

Market Beating Performance

stock-summaryMojo Parameters

Mojo Parameters

Loading Valuation Snapshot...

Stock DNA

stock-summary
Industry

Private Sector Bank

stock-summary
Market cap

INR 29,250 Cr (Small Cap)

stock-summary
Dividend Yield

0.84%

stock-summary
CAR

17.50%

stock-summary
Return on Assets

0.64%

stock-summary
Net NPA

0.93%

stock-summary
Gross NPA

3.15%

Revenue and Profits:
Int. Earned:
5,630.55 Cr
(Quarterly Results - Jun 2026)
Net Profit:
502 Cr
stock-summaryTotal Returns
Total Returns (Price + Dividend) stock-summary
Dividend Yield (0.84%)
TimePeriod
Price Return
Dividend Return
Total Return
3 Months
-11.24%
0.74%
-10.5%
6 Months
16.57%
1.01%
17.58%
1 Year
13.24%
0.93%
14.17%
2 Years
-11.98%
1.59%
-10.39%
3 Years
-25.93%
1.22%
-24.71%
4 Years
-35.71%
1.69%
-34.02%
5 Years
-34.98%
1.42%
-33.56%

Latest dividend: 1.5 per share ex-dividend date: Aug-17-2026

Risk Adjusted Returns v/s stock-summary
Returns Beta
Icon
Beta has not been calculated since enough price history is not available
stock-summaryNews & Corporate Actions

News

Announcements stock-summary

Update On Analysts / Institutional Investors Meet Held On September 21 2026

21-Sep-2026 | Source : BSE

Update on Analysts / Institutional Investors Meet held on September 21 2026.

Update On Analysts / Institutional Investors Meet Held On September 17 2026

17-Sep-2026 | Source : BSE

Update on Analysts / Institutional Investors Meet held on September 17 2026.

Update On Analysts / Institutional Investors Meet Held On September 11 2026

11-Sep-2026 | Source : BSE

Update on Analysts / Institutional Investors Meet held on September 11 2026.

Corporate Actions stock-summary

stock-summary
BOARD MEETING

No Upcoming Board Meetings

stock-summary
DIVIDEND

Bandhan Bank Ltd. has declared 15% dividend, ex-date: 17 Aug 26

stock-summary
SPLITS

No Splits history available

stock-summary
BONUS

No Bonus history available

stock-summary
RIGHTS

No Rights history available

stock-summaryKey Factors

Quality key factors stock-summary

Factor
Value
Net Interest Income Growth (5y)
5.93%
Net Profit Growth (5y)
-7.78%
Advance to Deposit
93.61%
Capital Adequacy Ratio (Tier 1)
17.40%
Gross NPA (latest)
3.15%
Gross NPA (avg)
5.27%
Coverage Ratio (avg)
72.51%
Cost to Income (avg)
46.13%
Net Interest Margin (avg)
7.07%
Operating Profit to Assets (avg)
8.42%
ROA (avg)
1.80%
Net Debt to Equity (avg)
0

Valuation key factors

Factor
Value
P/E Ratio
22
Price to Book Value
1.18
PEG Ratio
NA
Dividend Yield
0.81%
ROE (Latest)
5.36%
ROA (Latest)
0.64%
Net NPA to Book Value
5.59

Technicals key factors

Indicator
Weekly
Monthly
MACD
Bearish
Mildly Bullish
RSI
No Signal
No Signal
Bollinger Bands
Mildly Bearish
Bullish
Moving Averages
Bullish (Daily)
KST
Bearish
Bullish
Dow Theory
Mildly Bullish
Mildly Bearish
OBV
Mildly Bullish
Mildly Bullish
stock-summary Technical Indicator Scale: Bearish, Mildly Bearish, Sideways, Mildly Bullish, Bullish  Turned 
stock-summaryShareholding
Shareholding Snapshot : Jun 2026stock-summary
Shareholding Compare (%holding) stock-summary
Majority shareholders

Promoters

Pledged Promoter Holdings

None

Mutual Funds

Held by 37 Schemes (19.65%)

FIIs

Held by 262 FIIs (18.65%)

Promoter with highest holding

Bandhan Financial Holdings Limited (37.53%)

Highest Public shareholder

Sbi Balanced Advantage Fund (5.49%)

Individual Investors Holdings

13.13%

stock-summaryFinancial
[
  {
    "link": "quarterly",
    "btn_text": "All Quarterly Results",
    "header": "Quarterly Results Snapshot (Standalone) - Jun'26 - QoQ",
    "rhs": [
      {
        "prefix": "Interest Earned ",
        "suffix": "QoQ Growth in quarter ended Jun 2026 is 3.72% vs -0.05% in Mar 2026",
        "dir": 1
      },
      {
        "prefix": "Net Profit ",
        "suffix": "QoQ Growth in quarter ended Jun 2026 is -6.08% vs 159.81% in Mar 2026",
        "dir": -1
      }
    ],
    "table": {
      "header": [
        "Jun'26",
        "Mar'26",
        "Change(%)"
      ],
      "body": [
        {
          "field": "Interest Earned",
          "val1": 5630.55,
          "val2": 5428.43,
          "chgp": "3.72%",
          "chgp_class": "positive"
        },
        {
          "field": "Operating Profit (PBDIT)",
          "val1": "1,358.10",
          "val2": "1,441.16",
          "chgp": "-5.76%",
          "chgp_class": "negative"
        },
        {
          "field": "% of Net NPAs",
          "val1": "0.93%",
          "val2": "0.97%",
          "chgp": "-0.04%",
          "chgp_class": "positive"
        },
        {
          "field": "% of Gross NPAs",
          "val1": "3.15%",
          "val2": "3.27%",
          "chgp": "-0.12%",
          "chgp_class": "positive"
        },
        {
          "field": "Exceptional Items",
          "val1": "0.00",
          "val2": "0.00",
          "chgp": "",
          "chgp_class": "neutral"
        },
        {
          "field": "Net Profit",
          "val1": "501.67",
          "val2": "534.14",
          "chgp": "-6.08%",
          "chgp_class": "negative"
        }
      ]
    }
  },
  {
    "link": "half-yearly",
    "btn_text": "All Half Yearly Results",
    "header": "Half Yearly Results Snapshot (Standalone) - Sep'25",
    "rhs": [
      {
        "prefix": "Interest Earned ",
        "suffix": " Growth in half year ended Sep 2025 is -1.87% vs 22.42% in Sep 2024",
        "dir": -1
      },
      {
        "prefix": "Net Profit ",
        "suffix": " Growth in half year ended Sep 2025 is -75.82% vs 38.74% in Sep 2024",
        "dir": -1
      }
    ],
    "table": {
      "header": [
        "Sep'25",
        "Sep'24",
        "Change(%)"
      ],
      "body": [
        {
          "field": "Interest Earned",
          "val1": 10829.44,
          "val2": 11035.64,
          "chgp": "-1.87%",
          "chgp_class": "negative"
        },
        {
          "field": "Operating Profit (PBDIT)",
          "val1": "2,978.75",
          "val2": "3,795.99",
          "chgp": "-21.53%",
          "chgp_class": "negative"
        },
        {
          "field": "% of Net NPAs",
          "val1": "1.37%",
          "val2": "1.29%",
          "chgp": "0.08%",
          "chgp_class": "negative"
        },
        {
          "field": "% of Gross NPAs",
          "val1": "5.02%",
          "val2": "4.68%",
          "chgp": "0.34%",
          "chgp_class": "negative"
        },
        {
          "field": "Exceptional Items",
          "val1": "0.00",
          "val2": "0.00",
          "chgp": "",
          "chgp_class": "neutral"
        },
        {
          "field": "Net Profit",
          "val1": "483.83",
          "val2": "2,000.91",
          "chgp": "-75.82%",
          "chgp_class": "negative"
        }
      ]
    }
  },
  {
    "link": "nine-monthly",
    "btn_text": "All Nine Monthly Results",
    "header": "Nine Monthly Results Snapshot (Standalone) - Dec'25",
    "rhs": [
      {
        "prefix": "Interest Earned ",
        "suffix": "YoY Growth in nine months ended Dec 2025 is -1.54% vs 20.72% in Dec 2024",
        "dir": -1
      },
      {
        "prefix": "Net Profit ",
        "suffix": "YoY Growth in nine months ended Dec 2025 is -71.60% vs 11.61% in Dec 2024",
        "dir": -1
      }
    ],
    "table": {
      "header": [
        "Dec'25",
        "Dec'24",
        "Change(%)"
      ],
      "body": [
        {
          "field": "Interest Earned",
          "val1": 16260.68,
          "val2": 16514.37,
          "chgp": "-1.54%",
          "chgp_class": "negative"
        },
        {
          "field": "Operating Profit (PBDIT)",
          "val1": "4,423.76",
          "val2": "5,817.35",
          "chgp": "-23.96%",
          "chgp_class": "negative"
        },
        {
          "field": "% of Net NPAs",
          "val1": "0.99%",
          "val2": "1.28%",
          "chgp": "-0.29%",
          "chgp_class": "positive"
        },
        {
          "field": "% of Gross NPAs",
          "val1": "3.33%",
          "val2": "4.68%",
          "chgp": "-1.35%",
          "chgp_class": "positive"
        },
        {
          "field": "Exceptional Items",
          "val1": "0.00",
          "val2": "0.00",
          "chgp": "",
          "chgp_class": "neutral"
        },
        {
          "field": "Net Profit",
          "val1": "689.42",
          "val2": "2,427.40",
          "chgp": "-71.60%",
          "chgp_class": "negative"
        }
      ]
    }
  },
  {
    "link": "annual",
    "btn_text": "All Annual Results",
    "header": "Annual Results Snapshot (Standalone) - Mar'26",
    "rhs": [
      {
        "prefix": "Interest Earned ",
        "suffix": "YoY Growth in year ended Mar 2026 is -1.18% vs 16.32% in Mar 2025",
        "dir": -1
      },
      {
        "prefix": "Net Profit ",
        "suffix": "YoY Growth in year ended Mar 2026 is -55.43% vs 23.13% in Mar 2025",
        "dir": -1
      }
    ],
    "table": {
      "header": [
        "Mar'26",
        "Mar'25",
        "Change(%)"
      ],
      "body": [
        {
          "field": "Interest Earned",
          "val1": 21689.11,
          "val2": 21948.23,
          "chgp": "-1.18%",
          "chgp_class": "negative"
        },
        {
          "field": "Operating Profit (PBDIT)",
          "val1": "5,864.92",
          "val2": "7,388.69",
          "chgp": "-20.62%",
          "chgp_class": "negative"
        },
        {
          "field": "% of Net NPAs",
          "val1": "0.97%",
          "val2": "1.28%",
          "chgp": "-0.31%",
          "chgp_class": "positive"
        },
        {
          "field": "% of Gross NPAs",
          "val1": "3.27%",
          "val2": "4.71%",
          "chgp": "-1.44%",
          "chgp_class": "positive"
        },
        {
          "field": "Exceptional Items",
          "val1": "0.00",
          "val2": "0.00",
          "chgp": "",
          "chgp_class": "neutral"
        },
        {
          "field": "Net Profit",
          "val1": "1,223.56",
          "val2": "2,745.30",
          "chgp": "-55.43%",
          "chgp_class": "negative"
        }
      ]
    }
  }
]

Quarterly Results Snapshot (Standalone) - Jun'26 - QoQstock-summary

Jun'26
Mar'26
Change(%)
Interest Earned
5630.55
5428.43
3.72%
Operating Profit (PBDIT)
1,358.10
1,441.16
-5.76%
% of Net NPAs
0.93%
0.97%
-0.04%
% of Gross NPAs
3.15%
3.27%
-0.12%
Exceptional Items
0.00
0.00
Net Profit
501.67
534.14
-6.08%
Values in Rs Cr.
Direction Arrows
Interest Earned

QoQ Growth in quarter ended Jun 2026 is 3.72% vs -0.05% in Mar 2026

Direction Arrows
Net Profit

QoQ Growth in quarter ended Jun 2026 is -6.08% vs 159.81% in Mar 2026

Half Yearly Results Snapshot (Standalone) - Sep'25stock-summary

Sep'25
Sep'24
Change(%)
Interest Earned
10829.44
11035.64
-1.87%
Operating Profit (PBDIT)
2,978.75
3,795.99
-21.53%
% of Net NPAs
1.37%
1.29%
0.08%
% of Gross NPAs
5.02%
4.68%
0.34%
Exceptional Items
0.00
0.00
Net Profit
483.83
2,000.91
-75.82%
Values in Rs Cr.
Direction Arrows
Interest Earned

Growth in half year ended Sep 2025 is -1.87% vs 22.42% in Sep 2024

Direction Arrows
Net Profit

Growth in half year ended Sep 2025 is -75.82% vs 38.74% in Sep 2024

Nine Monthly Results Snapshot (Standalone) - Dec'25stock-summary

Dec'25
Dec'24
Change(%)
Interest Earned
16260.68
16514.37
-1.54%
Operating Profit (PBDIT)
4,423.76
5,817.35
-23.96%
% of Net NPAs
0.99%
1.28%
-0.29%
% of Gross NPAs
3.33%
4.68%
-1.35%
Exceptional Items
0.00
0.00
Net Profit
689.42
2,427.40
-71.60%
Values in Rs Cr.
Direction Arrows
Interest Earned

YoY Growth in nine months ended Dec 2025 is -1.54% vs 20.72% in Dec 2024

Direction Arrows
Net Profit

YoY Growth in nine months ended Dec 2025 is -71.60% vs 11.61% in Dec 2024

Annual Results Snapshot (Standalone) - Mar'26stock-summary

Mar'26
Mar'25
Change(%)
Interest Earned
21689.11
21948.23
-1.18%
Operating Profit (PBDIT)
5,864.92
7,388.69
-20.62%
% of Net NPAs
0.97%
1.28%
-0.31%
% of Gross NPAs
3.27%
4.71%
-1.44%
Exceptional Items
0.00
0.00
Net Profit
1,223.56
2,745.30
-55.43%
Values in Rs Cr.
Direction Arrows
Interest Earned

YoY Growth in year ended Mar 2026 is -1.18% vs 16.32% in Mar 2025

Direction Arrows
Net Profit

YoY Growth in year ended Mar 2026 is -55.43% vs 23.13% in Mar 2025

stock-summaryCompany CV
About Bandhan Bank Ltd. stock-summary
stock-summary
Bandhan Bank Ltd.
Small Cap
Private Sector Bank
Bandhan Bank Limited is a commercial bank focused on serving underbanked and underpenetrated markets in India. Bandhan Bank is the first instance in India of a microfinance entity transforming into a universal bank. The Bank a wide array of loans through Banking Unit (BU) outlets under Banking Units vertical to benefit small business owners in need of financial assistance. The Bank operates its Group Loans and Small Business & Agri Loans (SBAL) business channels from its BU outlets.
Company Coordinates stock-summary
Company Details
DN 32 Sector V, Salt Lake Kolkata West Bengal : 700091
stock-summary
Tel: 91-33-66090909
stock-summary
investors@bandhanbank.com
Registrar Details
Karvy Computershare Pvt Ltd., Karvy Selenium, Tower-B Plot No 31 & 32, Survey No 116/22, 115/24, 115/25, Financial District, Nanakramguda, Serilingampally, Mandal Ranga Reddy Dist, Hyderabad