
Compare Regaal Resources with Similar Stocks
Dashboard
Healthy long term growth as Net Sales has grown by an annual rate of 52.50% and Operating profit at 107.72%
The company has declared Positive results for the last 3 consecutive quarters
With ROCE of 11.6, it has a Very Attractive valuation with a 1.4 Enterprise value to Capital Employed
Rising Promoter Confidence
Stock DNA
Other Agricultural Products
INR 844 Cr (Micro Cap)
14.00
41
0.00%
0.95
12.37%
1.71
Total Returns (Price + Dividend) 
Regaal Resources for the last several years.
Risk Adjusted Returns v/s
Returns Beta

News

Regaal Resources Ltd is Rated Hold by MarketsMOJO
Regaal Resources Ltd is rated 'Hold' by MarketsMOJO, with this rating last updated on 14 Nov 2025. However, the analysis and financial metrics discussed here reflect the company’s current position as of 10 June 2026, providing investors with an up-to-date view of its fundamentals, valuation, financial trends, and technical outlook.
Read full news article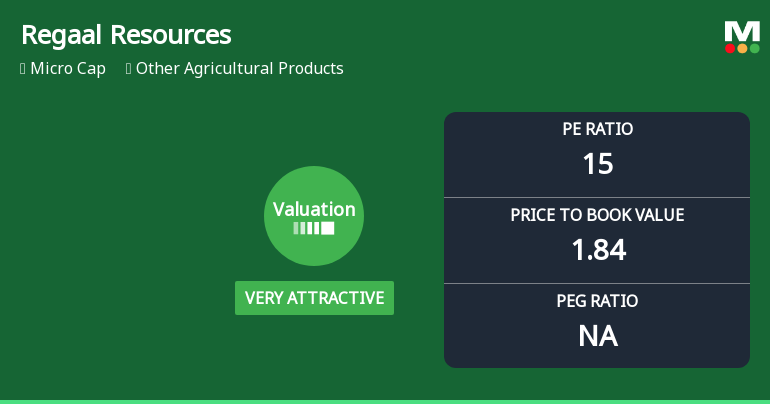
Regaal Resources Ltd Valuation Shifts to Very Attractive Amid Market Volatility
Regaal Resources Ltd, a micro-cap player in the Other Agricultural Products sector, has seen a notable shift in its valuation parameters, moving from an attractive to a very attractive rating. Despite a recent 4.44% decline in its share price to ₹86.42, the company’s price-to-earnings (P/E) and price-to-book value (P/BV) ratios now present compelling investment considerations relative to its historical averages and peer group.
Read full news article
Regaal Resources Ltd is Rated Hold by MarketsMOJO
Regaal Resources Ltd is rated 'Hold' by MarketsMOJO, with this rating last updated on 14 Nov 2025. However, the analysis and financial metrics discussed here reflect the company’s current position as of 30 May 2026, providing investors with an up-to-date view of its performance and outlook.
Read full news article Announcements
Announcement under Regulation 30 (LODR)-Earnings Call Transcript
03-Jun-2026 | Source : BSEPlease find enclosed Earnings Call Transcript for the quarter and financial year end March 31 2026
Announcement under Regulation 30 (LODR)-Newspaper Publication
28-May-2026 | Source : BSEPlease find enclosed clipping of Newspaper publication dated 28 May 2026
Announcement under Regulation 30 (LODR)-Analyst / Investor Meet - Outcome
28-May-2026 | Source : BSEPlease find enclosed the intimation for the Audio recording of Earnings Conference Call for the quarter and year ended March 31 2026.
Corporate Actions

No Upcoming Board Meetings

No Dividend history available

No Splits history available

No Bonus history available

No Rights history available
Quality key factors
Valuation key factors
Technicals key factors
 Technical Indicator Scale: Bearish, Mildly Bearish, Sideways, Mildly Bullish, Bullish Turned
 Shareholding Snapshot : Mar 2026
Shareholding Compare (%holding)
Promoters
None
Held by 1 Schemes (1.27%)
Held by 6 FIIs (0.34%)
Shruti Kishore Puria (27.48%)
Taurus Flexi Cap Fund (1.41%)
19.55%
Quarterly Results Snapshot (Standalone) - Mar'26 - QoQ

QoQ Growth in quarter ended Mar 2026 is -24.26% vs 0.92% in Dec 2025

QoQ Growth in quarter ended Mar 2026 is 24.83% vs -20.71% in Dec 2025
Half Yearly Results Snapshot (Standalone) - Sep'25
Not Applicable: The company has declared_date for only one period
Not Applicable: The company has declared_date for only one period
Nine Monthly Results Snapshot (Standalone) - Dec'25
Not Applicable: The company has declared_date for only one period
Not Applicable: The company has declared_date for only one period
Annual Results Snapshot (Standalone) - Mar'26
YoY Growth in year ended Mar 2026 is 23.93% vs 52.52% in Mar 2025
YoY Growth in year ended Mar 2026 is 16.55% vs 115.31% in Mar 2025
About Regaal Resources Ltd

Company Coordinates


