
Stock DNA
Oil
INR 1,763,154 Cr (Large Cap)
22.00
12
0.88%
0.17
8.94%
1.96
Total Returns (Price + Dividend) 
Latest dividend: 6 per share ex-dividend date: Jun-05-2026
Risk Adjusted Returns v/s
Returns Beta

News

Reliance Industries Ltd Sees High-Value Trading Amid Continued Downtrend
Reliance Industries Ltd, a heavyweight in the oil sector, recorded one of the highest value turnovers on 24 June 2026, with over ₹188.7 crores traded on the day. Despite this robust trading activity, the stock has shown signs of weakening momentum, slipping below key moving averages and edging closer to its 52-week low, signalling caution for investors amid rising institutional participation.
Read full news article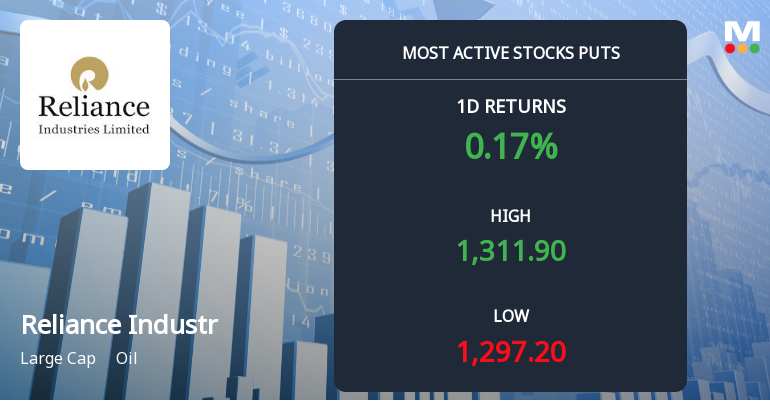
Rs 1300 Puts — Just Below Current Price — Draw 3,450 Contracts on Reliance Industries Ltd
The Rs 1,300 put strike on Reliance Industries Ltd attracted 3,450 contracts on 24 Jun 2026, just below the stock’s closing price of Rs 1,299.90. This near-the-money put activity, combined with a recent downtrend in the stock, raises questions about whether traders are positioning for further weakness or simply hedging existing holdings.
Read full news article
5,028 Call Contracts Traded on Reliance Industries Ltd as Stock Hovers Near Rs 1,350 Strike
On 24 Jun 2026, 5,028 call contracts at the Rs 1,350 strike price changed hands on Reliance Industries Ltd, with the stock closing at Rs 1,300.80. This activity, occurring just six trading days before the 30 Jun expiry, highlights a concentrated short-term directional interest in the stock near a key price level.
Read full news article Announcements
Disclosure Of Voting Results - Forty-Ninth Annual General Meeting (Post - IPO) Of The Company.
20-Jun-2026 | Source : BSEThe voting results along with the consolidated Scrutinisers report in respect of the Forty-ninth Annual General Meeting (Post-IPO) of the Company held on Friday June 19 2026 are attached.
Proposed Initial Public Offer Of Jio Platforms Limited
19-Jun-2026 | Source : BSEProposed Initial Public Offer of Jio Platforms Limited
Chairmans Statement Delivered At The Forty-Ninth Annual General Meeting (Post-IPO) Of The Company
19-Jun-2026 | Source : BSEChairmans Statement delivered at the Forty-ninth Annual General Meeting (Post-IPO) of the Company
Corporate Actions

No Upcoming Board Meetings

Reliance Industries Ltd has declared 60% dividend, ex-date: 05 Jun 26

No Splits history available

Reliance Industries Ltd has announced 1:1 bonus issue, ex-date: 28 Oct 24

Reliance Industries Ltd has announced 1:15 rights issue, ex-date: 13 May 20
Quality key factors
Valuation key factors
Technicals key factors
 Technical Indicator Scale: Bearish, Mildly Bearish, Sideways, Mildly Bullish, Bullish Turned
 Shareholding Snapshot : Mar 2026
Shareholding Compare (%holding)
Promoters
None
Held by 77 Schemes (9.78%)
Held by 1667 FIIs (18.67%)
Srichakra Commercials Llp (11.13%)
Life Insurance Corporation Of India (6.8%)
8.36%
Quarterly Results Snapshot (Consolidated) - Mar'26 - QoQ

QoQ Growth in quarter ended Mar 2026 is 11.01% vs 4.04% in Dec 2025

QoQ Growth in quarter ended Mar 2026 is -8.98% vs 2.64% in Dec 2025
Half Yearly Results Snapshot (Consolidated) - Sep'25
Growth in half year ended Sep 2025 is 7.54% vs 5.43% in Sep 2024
Growth in half year ended Sep 2025 is 42.45% vs -5.10% in Sep 2024
Nine Monthly Results Snapshot (Consolidated) - Dec'25
YoY Growth in nine months ended Dec 2025 is 8.51% vs 5.83% in Dec 2024
YoY Growth in nine months ended Dec 2025 is 27.00% vs -0.85% in Dec 2024
Annual Results Snapshot (Consolidated) - Mar'26
YoY Growth in year ended Mar 2026 is 9.59% vs 7.06% in Mar 2025
YoY Growth in year ended Mar 2026 is 15.98% vs 0.04% in Mar 2025
About Reliance Industries Ltd

Company Coordinates


